Case Volume and Loading for Long Range Precision: Part 1 The Basics

All long range competitive shooters agree that ammunition must be accurate at short range in order to be accurate at long range. They also know that this is a necessary condition, but not a sufficient one. In addition, the ammunition should have very low variation in muzzle velocity and the bullets should have a good ballistic coefficient.

Many factors influence muzzle velocity, and variation in these factors will lead commensurate variation in muzzle velocity. These include:

  • Powder charge
  • Case neck tension
  • Case mouth uniformity
  • Flash hole uniformity
  • Primer consistency
  • Bullet weight
  • Bullet seating depth
  • Case volume
  • Recoil technique (strange but true – a topic for another post)

Each of these factors has a limit to which we can minimize variation, and at some point the effort to decrease variation leads to diminishing returns. In this article I will consider ammunition that is between reasonably and superbly controlled for most of the factors in the list and both how and how much controlling additionally for case volume can result in improved variation in muzzle velocity.

Suppose Case Volume was the Only Factor

The simplest place to start is with ammunition that is perfect in every way except for variation in case volume. Quickload and experiment have both shown that for many typical cartridges, powders, bullets, etc., muzzle velocity varies with case volume at a rate of approximately 20 fps to 30 fps per grain of H2O as a measure of case capacity. From here I will use “grains” in place of “grains H2O”, the “H2O” being implied.

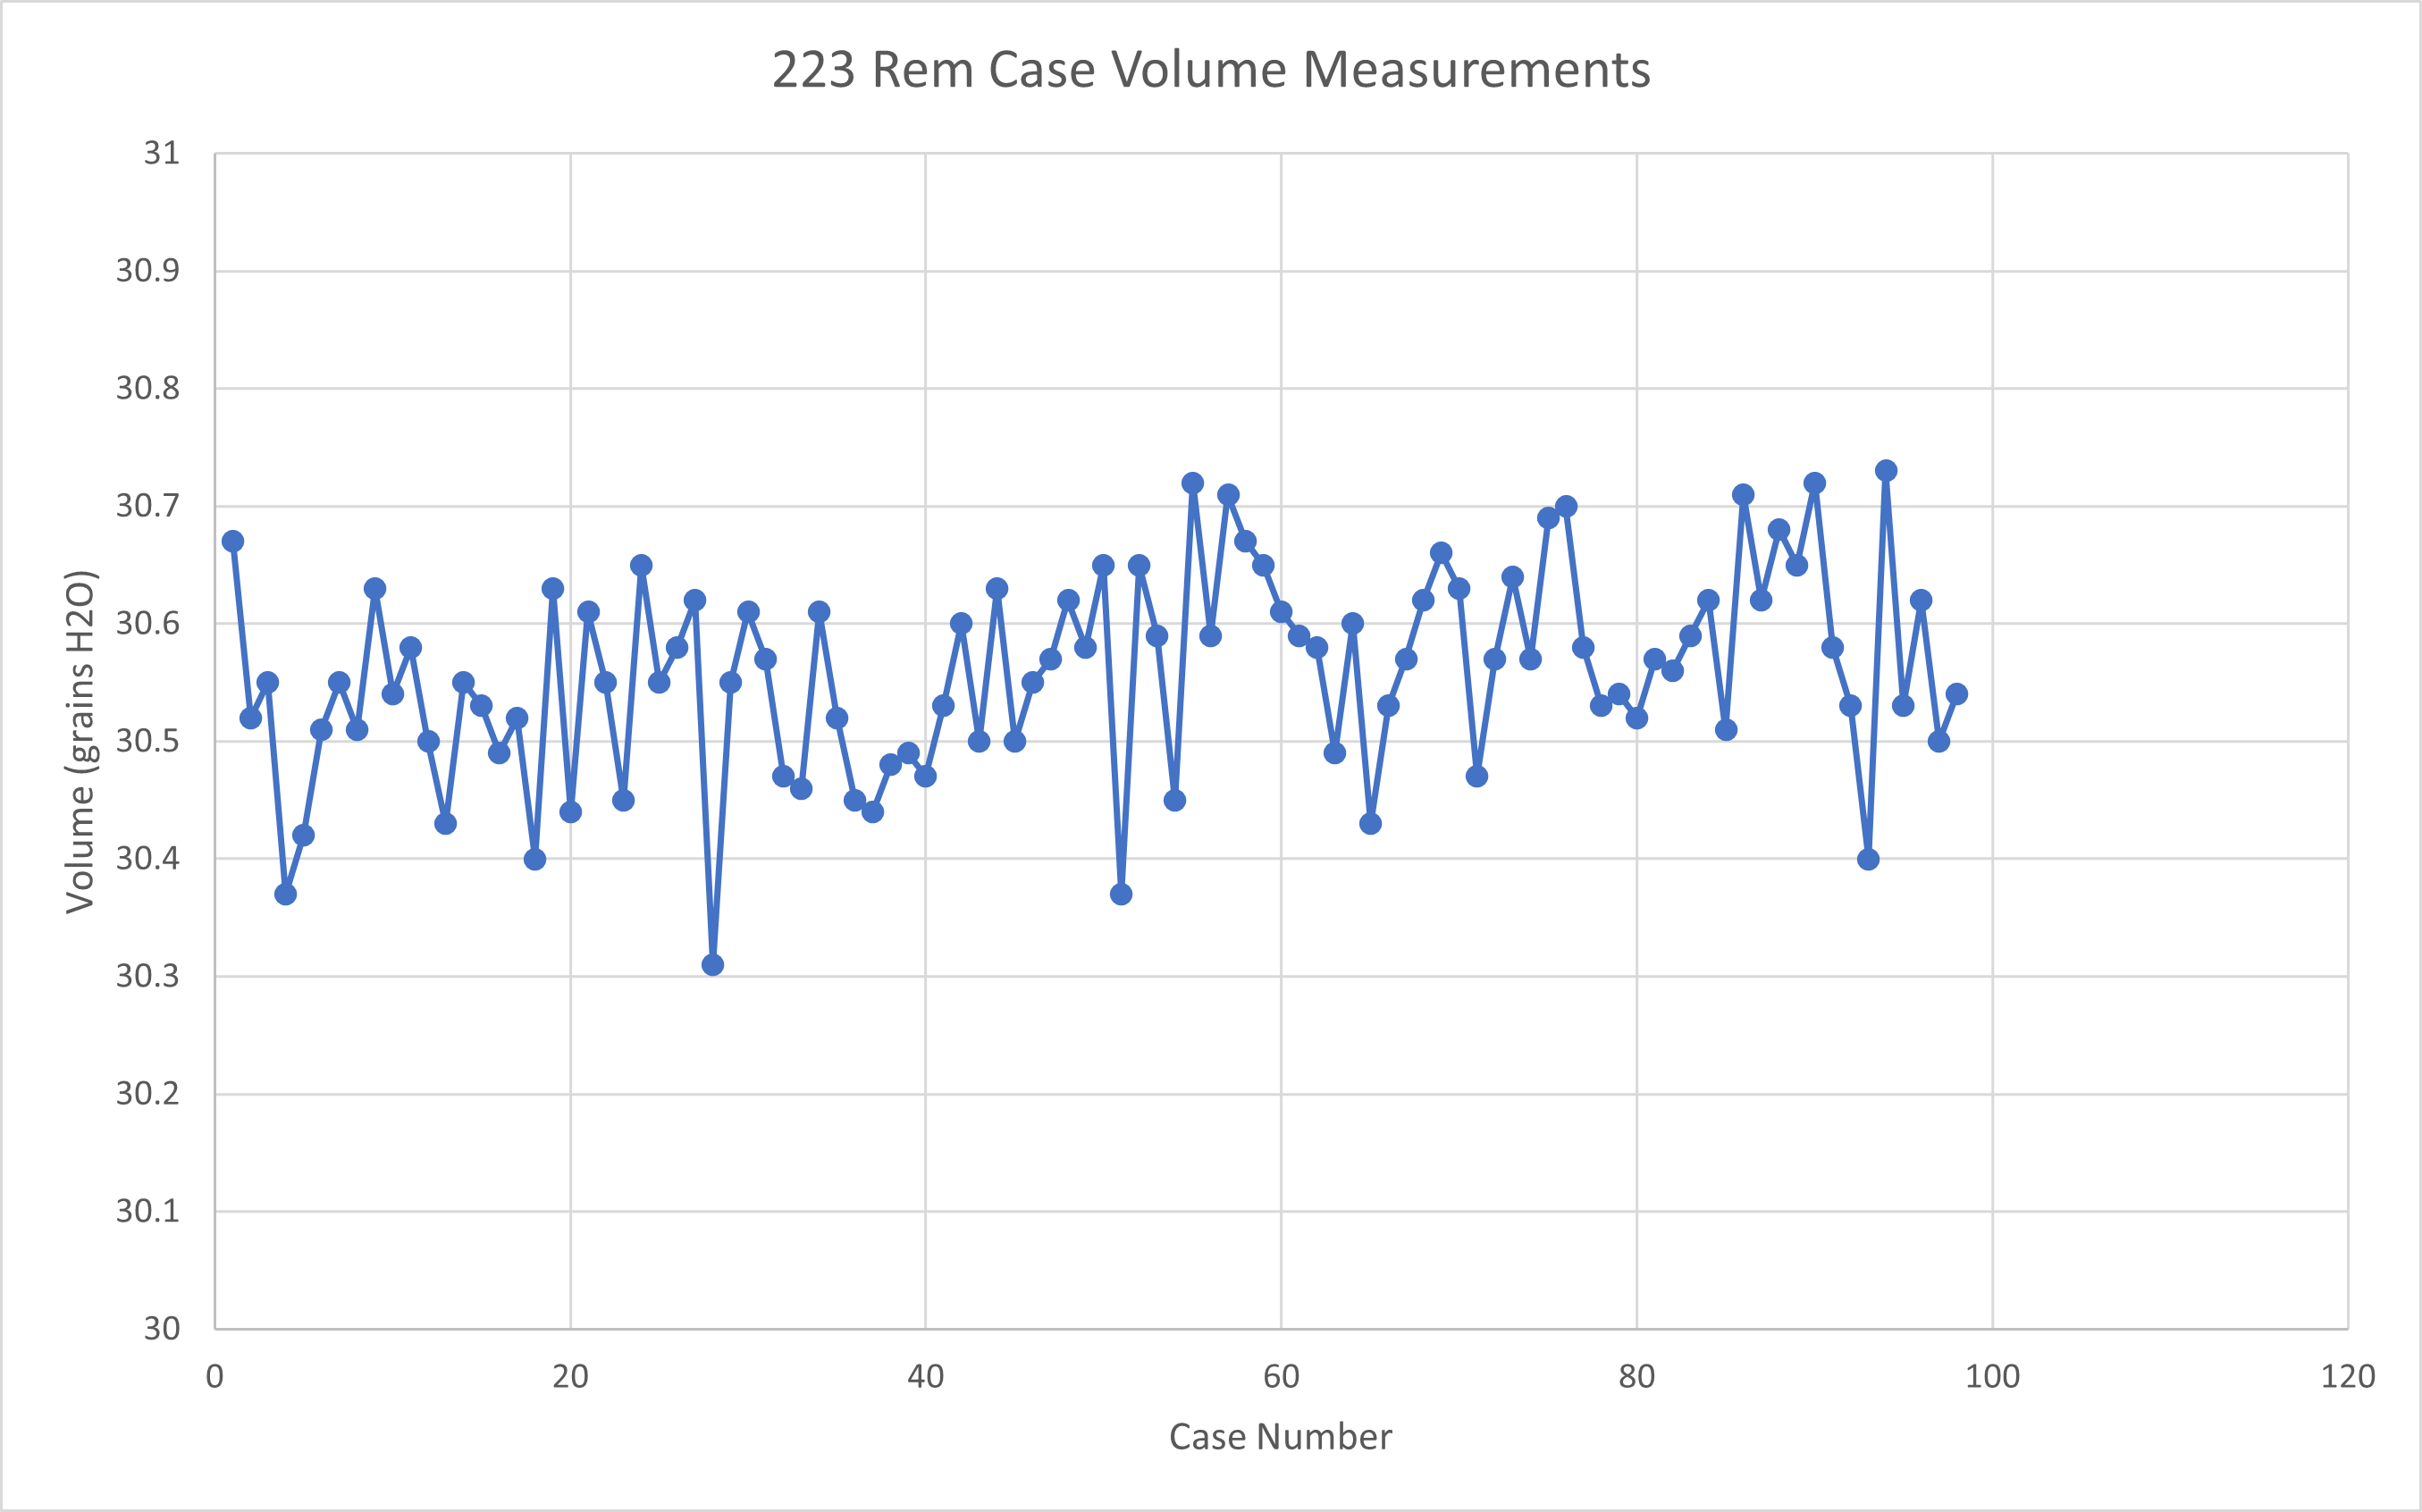
Consider ammunition from a simulated population of 500 284 Win cases in which the volume of the cases is normally distributed about a mean of 69.1 grains with a standard deviation of 0.175 grains. I got the mean and SD used here from real world measurement of 100 cases. Assuming that a case with 69.1 grains capacity produces 2800 fps muzzle velocity for a 180 grain Berger Hybrid, and a 20 fps per grain volume variation, a randomly generated population is shown in the following graph:

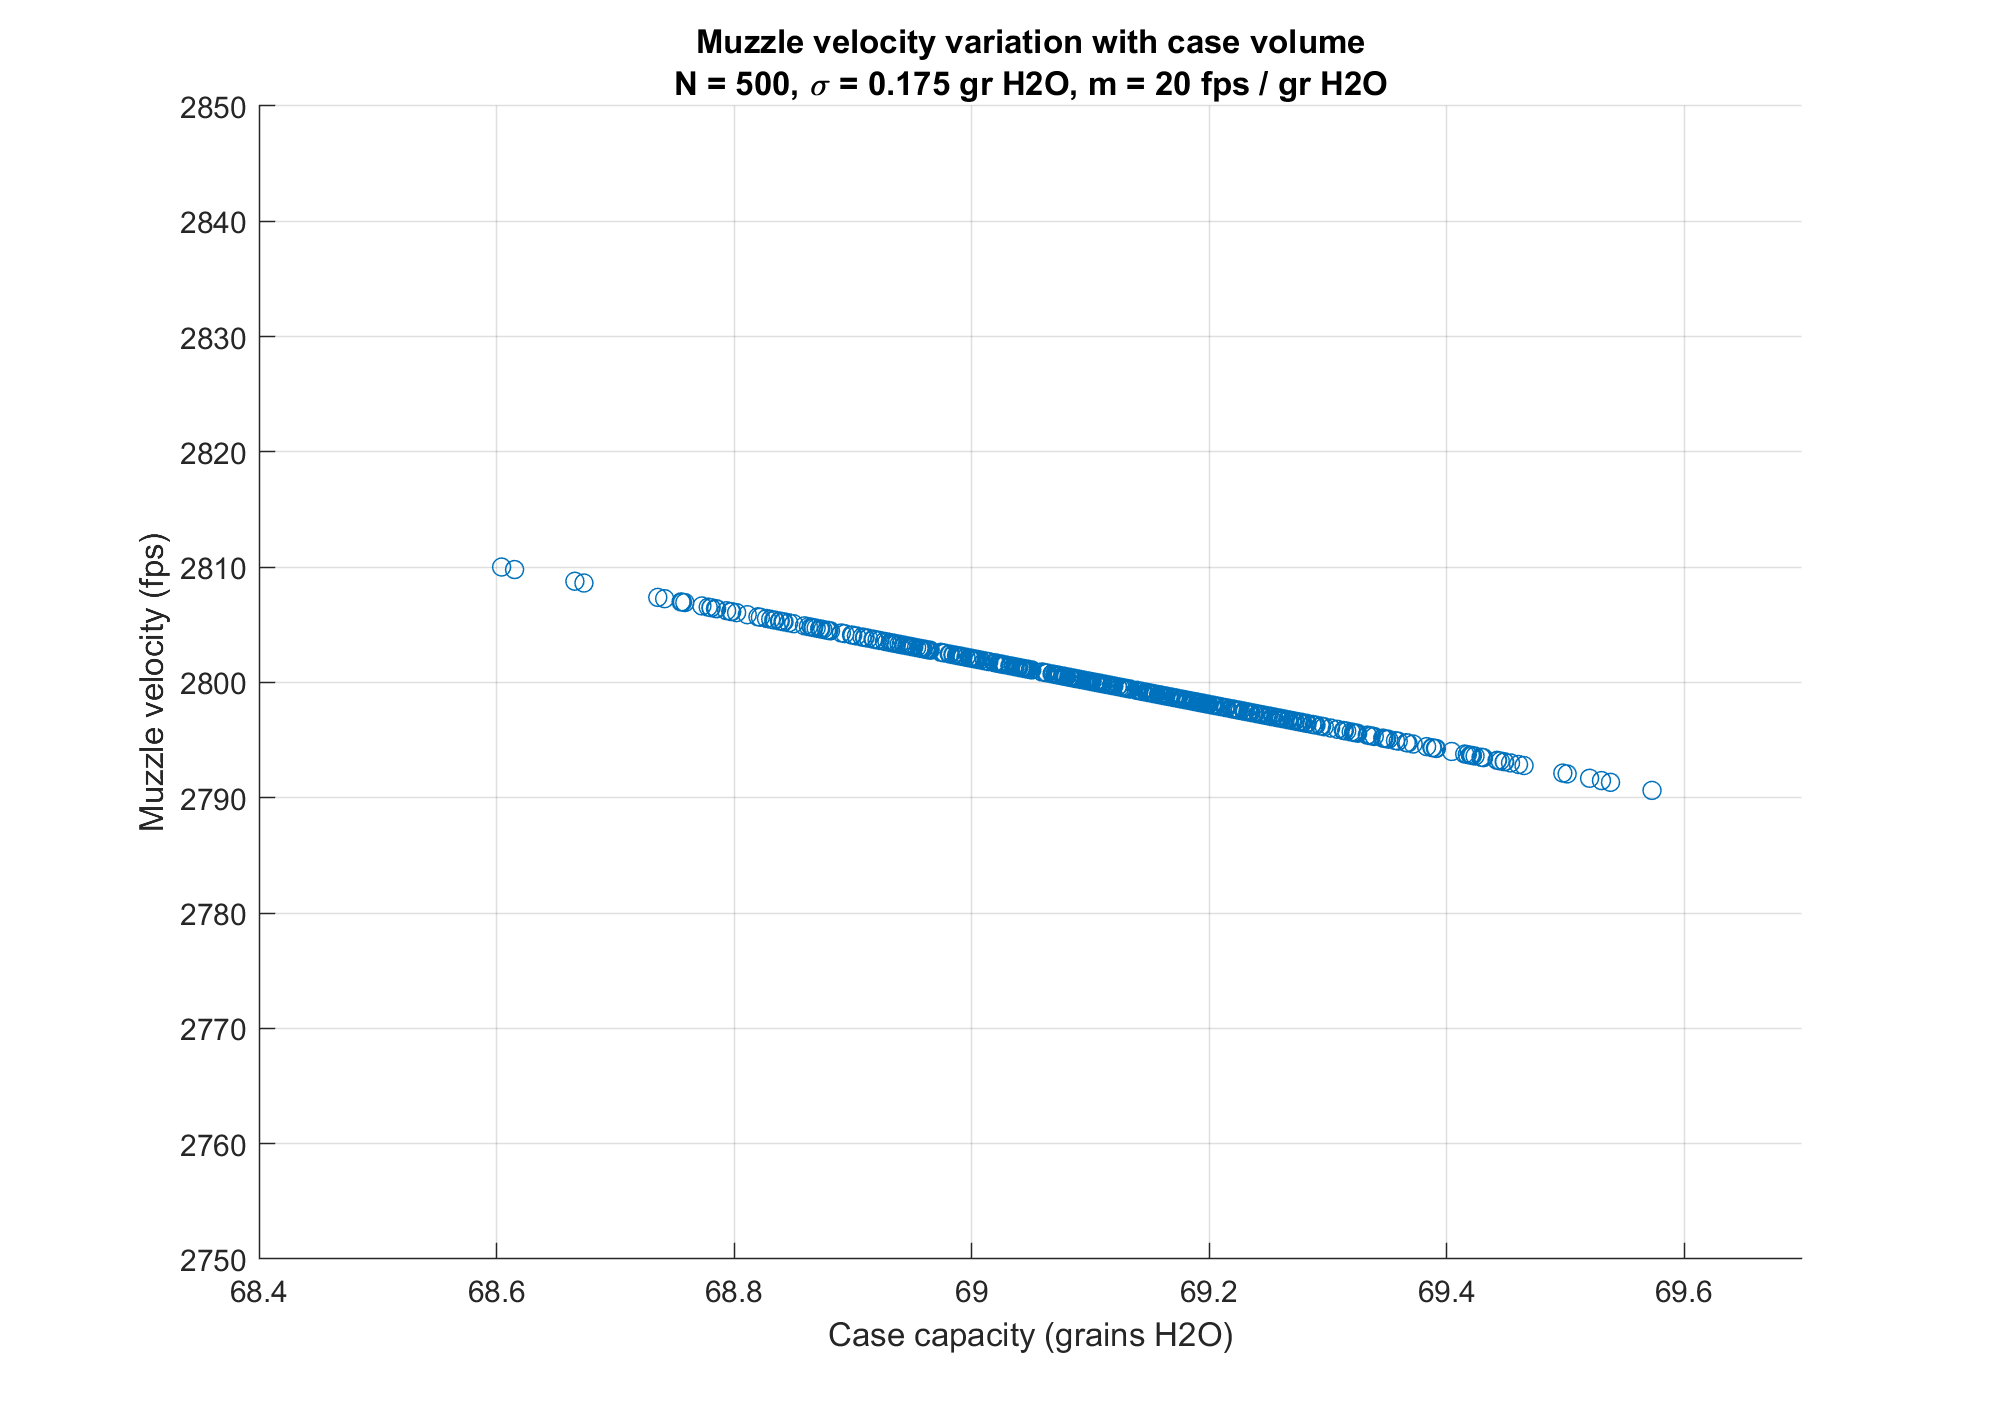
Most of the muzzle velocities are centered around 2800 fps as expected and we see a high an extreme spread of about 20 fps, which is not surprising since the population of cases has an extreme spread of case volumes that is about 1 grain.

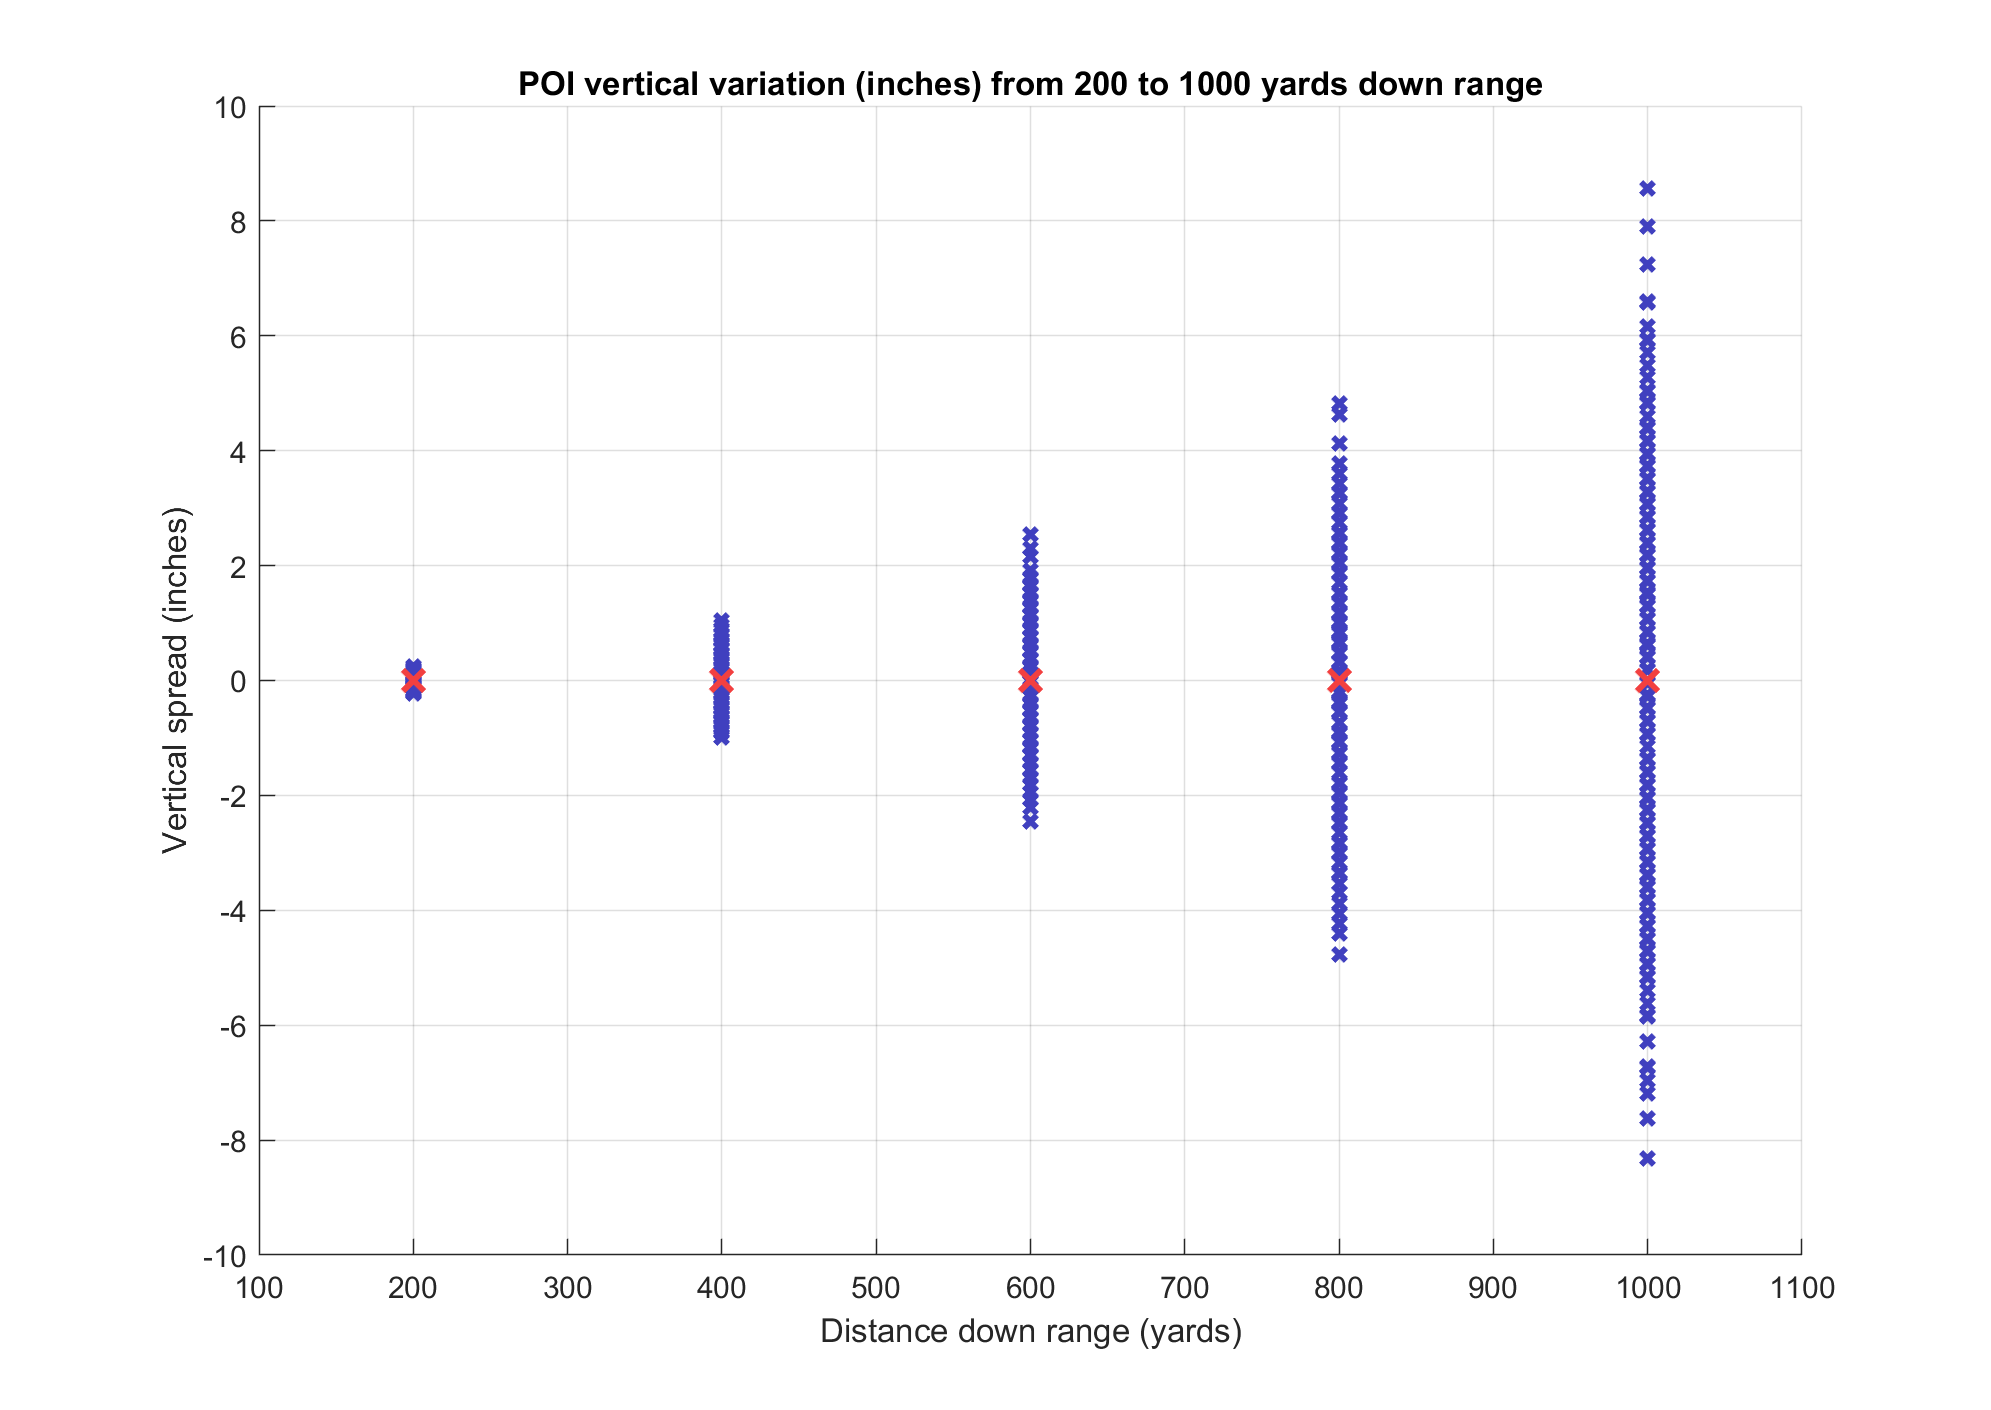
So what does this mean in practice? How will this otherwise perfect lot of ammunition shoot, all else being perfect? Using a typical G1 drag model for the Berger 180 Hybrid we get the following vertical distribution on paper from 600 to 1000 yards down range:

And again with vertical dispersion measured in minutes of angle instead of inches:

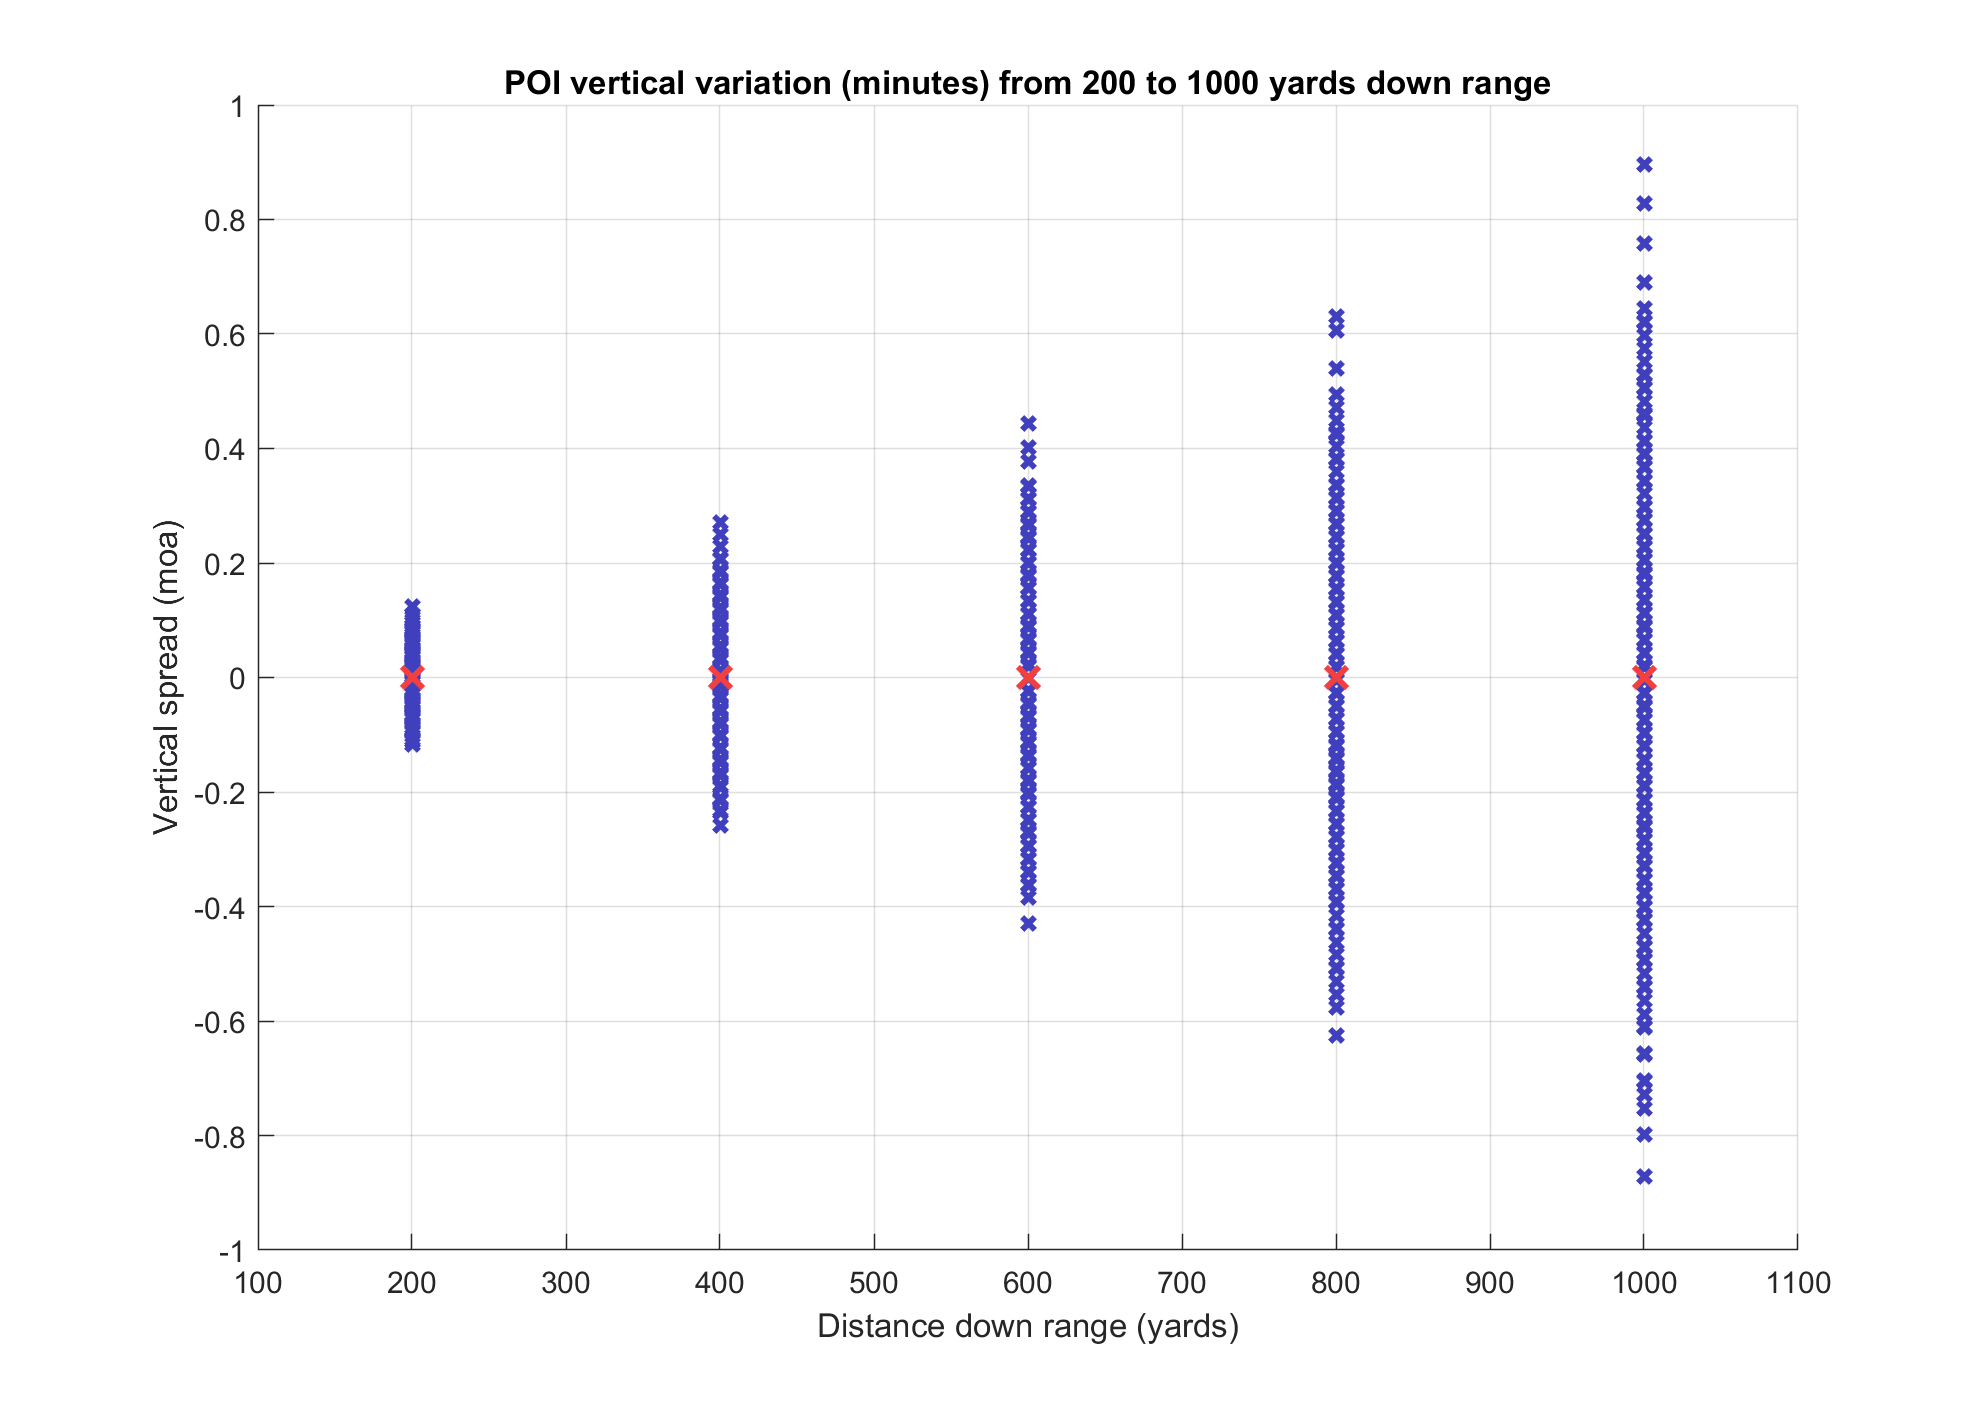
I prefer looking at the plot that shows POI vertical variation in minutes because it is easier to relate to score in high power rifle competition. At 200 yards the vertical variation is very small at just over +/- 0.1 minutes. I don’t know many people outside short range bench rest who would lose too much sleep over that. At 600 yards we’re approaching +/- 0.5 minutes, now that’s something. In Service rifle that can cost you an X or a point, and in F-Class we are definitely talking points to lose for a shot that would otherwise be near the inside edge of scoring a 10, and at 600 yards these days, X-count often separates winners and losers.

For those of us who shoot long range matches, which are typically from 800 to 1000 yards and shot on an LR or LR-F target, you can see that we’re talking serious points to lose with the vertical spread approaching +/- 1 moa.

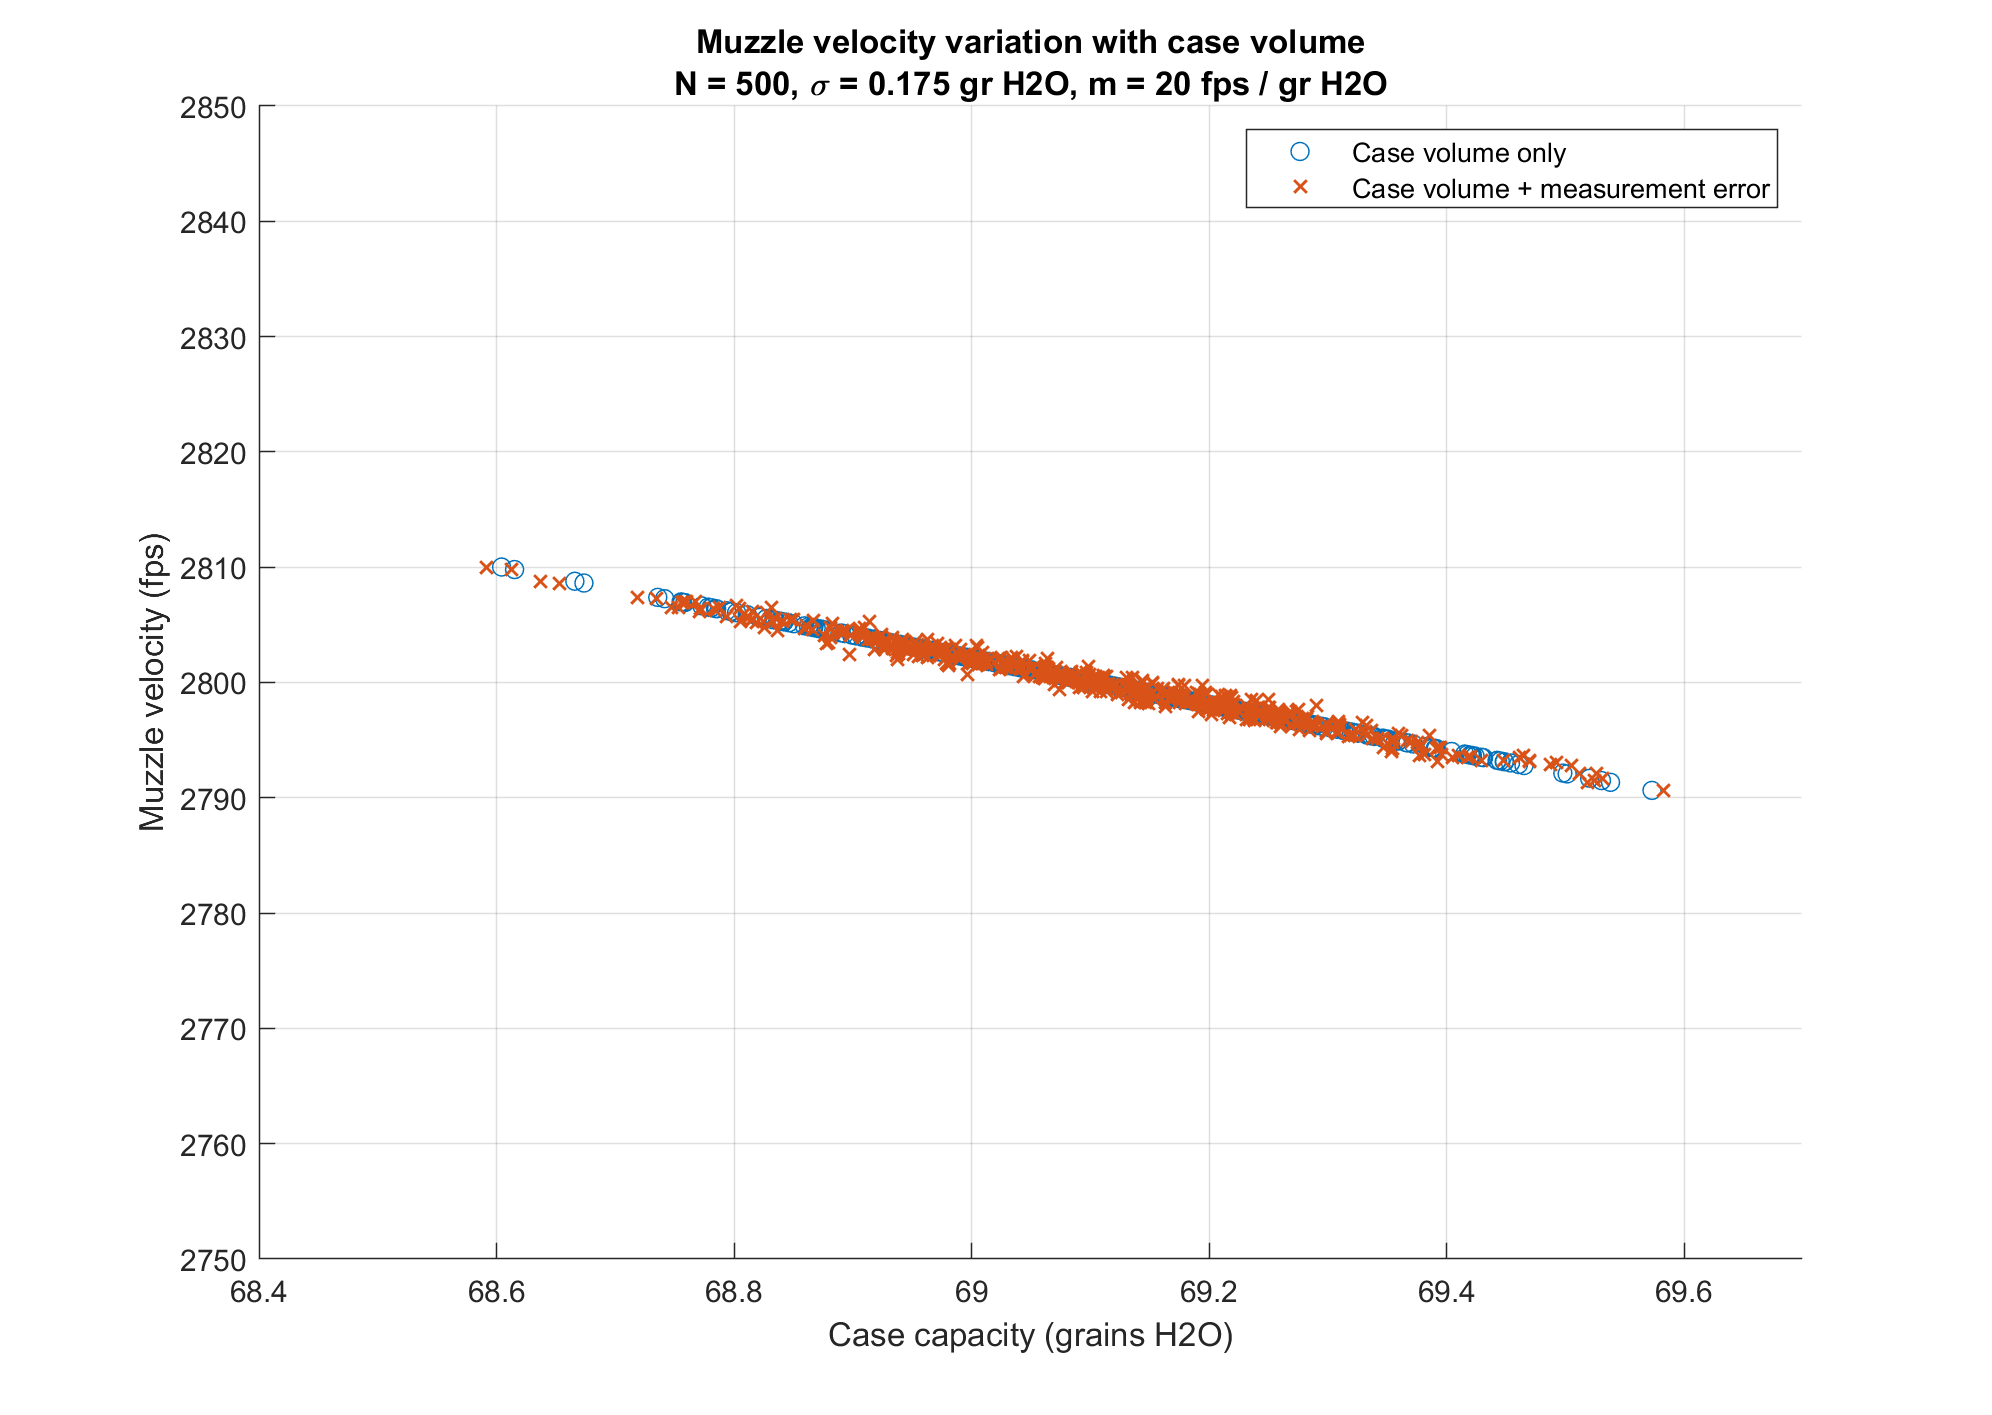
Adding Measurement Error

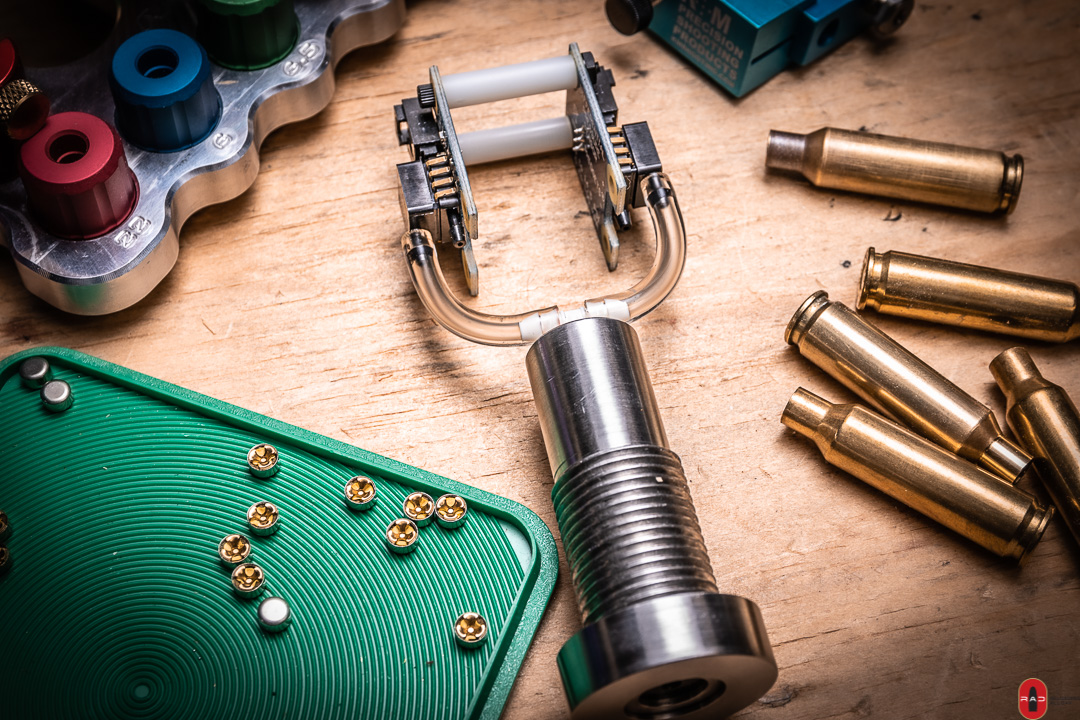
We cannot measure case capacity perfectly. How much does measurement error influence our results so far? With the Bison Armory Case Capacity Gauge, I have performed some experiments to determine measurement error and a normal distribution with zero mean and standard deviation of 0.025 grains fits the data. Adding random measurement error to the muzzle velocity vs case capacity shown earlier, in which we keep the muzzle velocity where it was for the perfect case and only vary the measurement due to error we get the following:

I think it is clear from this figure that case capacity measurement error is not a significant factor. If case volume was the only contributor to muzzle velocity variation, and we can measure case capacity as accurately as indicated in the figure, then it would be a simple thing to produce a batch of ammunition for a match that had minimal velocity spread.

Of course it’s not so simple. In the next post I’ll add muzzle velocity variation from all other sources and we’ll see how that complicates matters, and also how to make the best use of case capacity measurements to decrease muzzle velocity dispersion.

308 Win Case Capacity and Muzzle Velocity

I conducted a brief study of case capacity and its effect on muzzle velocity this weekend. Such studies are easy because spending time at the rifle range is fun. They are also difficult because time is limited and it takes a lot of trigger time to get statistically significant results.

This study is not rigorous in that insufficient data was collected to prove any correlation between muzzle velocity and case capacity for a given brand of case, but enough data was collected to show a link over several brands of cases. The difficulty here is that there is more to muzzle velocity variation than case volume, but if the variation in capacity is great enough, we see the effects clearly.

Starting with the case capacity in grains of H2O between a selection of new and once fired 308 Win brass from Lapua (once fired), Federal (once fired), SSA (new), Winchester (new), and Hornady (once fired).

SSA has the lowest capacity while Hornady and Winchester were about the same at the highest capacity. Approximately 2 grains of H2O capacity separate the lowest from the highest. We expect that all else being equal (i.e. the same powder charge and bullet weight etc.), the cases with the lowest capacity will exhibit the highest muzzle velocity and vice-versa. Here’s the results from the range session shooting off-hand with an M14 (shot pretty well, one 10-round string was 96-2x)

In this figure clear correlation between case volume and muzzle velocity is apparent. Obviously other factors influence muzzle velocity besides case volume as there is significant variation in muzzle velocity that does not correlate with case volume. For example, the SSA brass (grey dots) has lower muzzle velocity than the Federal brass (orange dots) even though it clearly has lower case volume, which generally correlates with higher muzzle velocity.

Given that the powder charges were thrown by an Autotrickler to 41.2 +/- 0.02 grains of H4895, the powder charge is the most consistent thing besides bullet weight at 168 grains for the Sierra Match King bullets used in this test. Notice also that for each 10-shot group except for the group shot with Hornady brass, the variation among the group does not correlate much at all with case volume. This is to be expected with sample sizes this small. Even so, the correlation among the data in general agrees with the prediction made by Quickload between 20 and 30 fps per grain of case volume, all else being equal.

The Hornady brass did show good correlation between case volume and muzzle velocity so let us consider it more closely.

This correlates with the prediction given by Quickload but is still too small a data sample to be taken as strong evidence. And there lies the problem as always with load development and accuracy: the difficulty with which we obtain meaningful results due to the constraints involved in gathering statistically significant data. Barrels heat up, fatigue sets in, Lab Radars fail to register a shot, and so on.

Ideally I would turn necks and be very careful about neck tension, flash holes, and the rest, and then shoot 50 to 100 rounds of each brand case. I’ve also found that correlation is stronger if the volume of the fired case is measured before resizing and compared with the muzzle velocity from the previously fired shot.

So take the data as it is, a point from which we can move forward, no more, no less, and an indication that what we expect is true, so now we have to be more careful to prove it.

In an upcoming article I will discuss strategies for using case volume measurements to inform load development for match shooting at 600 yards and beyond.

Measuring Cartridge Case Volume

In this post I address the use cases for measuring case volume. Reloaders have gotten by for quite a while without measuring the volume of every case. Most reloaders never measure case volume. What are the reasons anyone would want to?

If you are interested in the Bison Armory Case Volumizer you can see them in our online store here.

In the past, measuring case volume was a slow task. Typically the reloader would weigh a case, fill it with water, then re-weigh the case to measure the weight of the water that filled the case. Obviously not the most desirable method. With the new Bison Armory case volumizer, the task is simplified to the point that it takes only minutes to accurately measure the volume of 100 or more cases.

Prior to this, there was not much point in discussing the reasons for measuring case volume. The cost in terms of time and effort were simply not worth the resulting information. Now that cases are easily measured with the Bison Case Volumizer (BCV), the question of why becomes interesting.

Checking for bad cases

Split case necks and other defects are real. Are you hunting? Shooting in a match? Going to a training class? The BCV easily detects any case with split neck or other compromise to its structure. A volumized case is one you can rely on.

Pushing the limits

Bison Armory does not advise pushing muzzle velocity to the limits, but we know some reloaders will do this. Suppose you are reloading all Winchester cases and a Starline case sneaks in. If you are pushing velocity to its maximum safe limits, a case with lower capacity than expected, like you might get from one from another brand sneaking into your batch unknown, could cause catastrophe. The BCV will detect these cases. In addition, suppose a new lot from the same manufacturer happens to be low. Manufacturing tolerances will vary somewhat even for the best manufacturers. The BCV when used properly and within its limitations, will alert the reloader to these sort of situations.

Long range accuracy

At 500 yards and beyond, variation in muzzle velocity starts to have a significant effect on accuracy. I shoot long range matches in F-Class and Service Rifle categories. Pushing the 223 Rem to 1000 yards is a lot of fun with the right bullets, but how much does variation in case volume affect long range accuracy? Quickload is a handy tool for cursory investigations into this question.

We can start with the common question of how much does variation in powder charge affect velocity and hence vertical dispersion at long range. For the 223 Rem with my personal load of 22.2 grains of H4895 in a Winchester case behind a 90 grain Sierra MatchKing bullet, we find a nominal muzzle velocity of 2550 fps. Quickload says +/- 0.1 grains of H4895 will result in +/- 10 fps out the muzzle. For my pet 223 long range load, that means the following vertical dispersion at distance:

Distance (yards)Velocity Low/High (fps)Drop Low/High (in)Drop Low/High (moa)
6001718 / 173486.9 / 85.213.8 / 13.6
7001601 / 1617 134.6 / 13218.4 / 18
8001492 / 1506 195.8 / 192.123.4 / 22.9
9001390 / 1404272.8 / 267.628.9 / 28.4
10001298 / 1310367.7 / 360.735.1 / 34.4

Now we know why long range shooters spend $1000 on an Autotrickler powder measure in order to throw charges quickly to +/- 0.02 grains. 1.7 inches at 600 yards and 7.0 inches at 1000 yards will lose you some X’s and 10’s.

What about case volume variation? Quickload tells us that variation of +/- 0.25 grains of powder will result in a muzzle velocity spread of 20 to 30 fps in the 223 Rem and variation of +/- 0.5 grains in the 260 Rem will see about 20 to 30 fps variation as well, depending on bullet, powder, and powder charge etc. As a fraction of case volume the variation is about the same.

Note: The velocity change for 223 Rem from +/- 0.25 grains of case volume is about the same as for +/- 0.1 grains of charge weight. So if you care about charge weight variation you probably ought to at least be interested in case volume variation.

I have verified this through experiment. Admittedly not a huge numbers on the surface, but how will this affect my performance in a match? With a low muzzle velocity of 2546 and a high of 2563 (difference of only 18 fps) we get the following trajectory table using Hornady’s ballistics calculator:

Distance (yards)Velocity Low (fps)Velocity High (fps)Drop Low (in)Drop High (in)Diff (in)Drop Low (moa)Drop High (moa)Diff
(moa)
5001847186150.649.90.79.79.50.2
6001723173686.3851.313.713.50.2
70016061619133.7131.72.018.2180.2
80014971508194.6191.63.023.222.90.3
90013951406271266.94.128.728.30.4
100013021312365.3359.75.634.934.40.5

The X-ring of the MR target is 3 inches and the 10 ring radius is 6 inches. At 500 yards the 0.7 in difference between high and low is pretty small but could cost an X or a 10 on shots that the shooter puts at the outside of the ring. At 600 yards the variation almost doubles and can start costing X’s and points.

For 800 to 1000 yards we shoot at the NRA LR target with an X-Ring that is 5 inches in radius and a 10-Ring that is double with a 10 inch radius. It is clear that the difference of 3, 4.1, and 5.6 inches between the low and high velocity values at 800, 900, and 1000 yards respectively can cost a lot of X’s and points. At 1000 yards in particular, the vertical dispersion is slightly larger than the width between rings.

Volume variation in Winchester 223 brass

I measured the volume of 98 Winchester 223 Rem brass cases and got the following results

The low value was 30.31 grains H2O and the high value was 30.73 for an extreme spread of 0.41 grains with a mean of 30.56, a median of 30.57, and a standard deviation of 0.09 gr H2O. Pretty good results actually. I’ve seen outliers with much bigger deviations. This is good brass. An outlier will definitely cost points during a match.

Once measured, what do you do with the cases? My personal approach is to omit any outliers and then split the rest at the mean or median to use for a 20 round match plus sighting shots. In this situation they are effectively the same. In this way I assure that my ammunition for a 20 round match will exhibit minimal vertical dispersion at long range, having in this instance a variation in case volume of +/- 0.1 grains H2O

In the next article I will compare measuring case volume by water weight using an FX-120i scale with the results from the Bison Armory Case Volumizer.

Accuracy Analysis

I’m going to start posting results of range sessions once or twice a month as we get our accuracy analysis up to speed. Right now the plan for a given weapon is 3 10-shot groups, so 30 shots total. Time between shots 30 to 60 seconds, 100 yards, mild conditions (hopefully), and the 3 10-shot groups will be taken with no scope adjustments so that they can be compiled into a single 30-shot group. Time between groups could be 5 to 30 minutes and is not deemed relevant, except that the barrel will have had a chance for substantial cool down.

The following image indicates what I hope to produce for these updates, which will be used to characterize a given barrel and weapon:


That 100 yard 10-shot group is just an example as I’m still working on presentation. The group was shot with one of our 18″ .223 Fulcrum barrels with 77gr Federal Gold Medal Match ammunition. In the future I plan to measure bullet velocity with with my LabRadar unit. The Sigma values  above indicate that this rifle and ammo combination is no worse than low Class 5, and probably Class 3. This is as much information as can be gleaned from 10 shots, which is one reason why 3-shot and 5-shot groups are dubious for gleaning weapon accuracy. I took 15 other shots with Hornady 75 grain match ammo and when both groups are centered and combined, just for example to get more shots in the group, I get the following retults:


In this case the Sigma value over a 95% confidence range tighten up from [.221, .433] to [.265, .397]. This indicates the rifle is no worse than Class 4, and could reasonably be Class 3 (especially given that I was the shooter and I’m not particularly good). Class 3 is realistically as good as auto-loading rifles get so this is the target, so to speak, for a competition gun like this one. For grins we can separate the two different groups and overlay to see how the different ammo shot:

I didn’t measure muzzle velocity of any of the shots, but that is planned for future analysis. In the future we can tag any given shot with a muzzle velocity and then analyze the results.

The important takeaway is that it takes a lot of shots to properly characterize weapon accuracy, and that even with a lot of shots, the accuracy potential of the weapon is hard to nail down with a lot of precision. Still, were confident that we can back up our Class 5 guarantee on our products, and that we’ll be able to zero-in on that number a lot better with more data.