6.8 SPC Range Time (UPDATED)

Measured my 22″ heavy 6.8 chamber with a Hornady OAL gauge. Several bullets measured out as follows:

Sierra 115 SMK

  • 2.384″ OAL to lands
  • 2.352″ for full neck engagement

Berger 130 VLD

  • 2.471″ OAL to lands
  • 2.381″ for full neck engagement

Nosler 110 Accubond

  • 2.407″ OAL to lands
  • 2.457″ for full neck engagement

Nosler 130 Ballistic Tip

  • 2.563″ OAL to lands
  • 2.572″ for full neck engagement

Interesting that the Nosler bullet shapes are such that the bullets seat deeper when into the lands than the maximum length for full case neck engagement. In the end I decided on the Berger 130 VLD for range testing. My loads are from Western Powders and I went with Accurate LT-30. They list the following load data

  • COAL: 2.350″
  • 23.4 to 26.0 charge weight
  • 2158 to 2404 fps

I went with a COAL of 2.38″ and ran loads of 23.9, 25.0, and 25.7 grains. I’m far enough from the lands to expect no significant pressure increase and I have plenty of case space at this loading depth for the given loads. I measured the muzzle velocity at 2300, 2395, and 2475 fps respectively for the three different loads. The 25.7 load charge gave me this 10 shot group at 100 yards:

Not bad at all! I was having some issues with this rifle and factory ammo, and I thought I’d try loading long to see what I could get. The COAL is much longer than mag length, so I had to individually chamber each round. I was shooting a Mega side-charge setup, so I was using it like a single shot, straight-pull, bolt action rifle. Statistics worked as follows:

  • Mean radius: 0.404 MOA
  • Extreme spread: 1.21 MOA
  • Sigma: 0.322 MOA

UPDATE: I inadvertently counted the outlying shot twice. After correcting the statistics look like this:

Definitely very good. On the other hand, the weakness of even a single 10-shot group is apparent in the 95% confidence intervals. Still this rifle with the given hand load is at worst Class 4, and Class 3 is very likely. In this case, the likely P1x for this combination is 0.59 MOA for the estimated Sigma, and at worst about 0.85 MOA. I need to put more rounds down range to get a tighter estimate, but things are looking good.

Solid BACS class 3 rifle with this load. I’m going to load these to PRI magazine length right at 2.30″ and see what I can get next time. Here’s a shot of the rifle from an earlier session, although now it’s wearing a PRS stock and Vortex PST scope:

Ben squinting his way through a nice 105 yard group

For next time, I thought of backing off the powder a bit and load to mag length of 2.300″. You can see the difference below between the 2.38″ and 2.30″ rounds:

I’m especially curious what velocity and accuracy I’ll get with the reduced COAL. The loading manual states 26.0 grains of LT-30 at a COAL of 2.35″ and I only went to 25.7 grains at 2.38″. I think given that at 2.26″ they state 25.1 grains is max safe load, that I can keep this load at 25.7 grains at 2.30″.

I’ve also worked up some 2.300″ loads of Benchmark under 115 Sierra Match King bullets. I want to run this load in my Fulcrum and Recon barrels. Here’s the round compared to a factory Remington 115 BTHP:

Range report this coming weekend.


MOA, Sub MOA, and Accuracy Indicators

To start, a list of Jargon, Concepts, Variables, and Acronyms:

  1. BAC
  2. MOA and sub MOA
  3. Rayleigh Distribution
  4. σ and Mean Radius
  5. Accuracy Indicators (MR, P1x, ES, etc.)
  6. Computing P1x from CEPYY

Many rifle and component manufacturers guarantee MOA or even Sub MOA performance from their products. Claims of MOA and sub MOA weapon performance is prolific within the shooting community. Using the Ballistic Accuracy Classification system (BAC™) I will show how the different weapon classes within BAC relate to plausible claims of MOA and sub MOA accuracy.

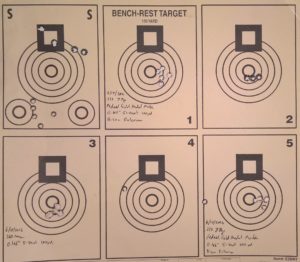
To begin, we neglect environmental effects, especially wind, precipitation, air temperature, and the rest, and choose to focus on effects of rifle, shooter, and ammunition. Essentially, we’re looking at effects that dominate shooting rifles from the bench at 50 to 100 yards. These effects extend to longer ranges and different shooting positions, but these scenarios must consider environmental effects and shooter skill which are neglected in this discussion.

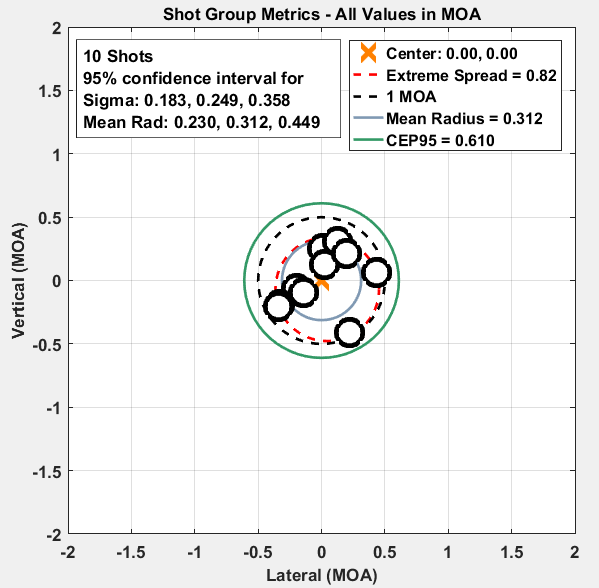
Weapon accuracy is described by the Rayleigh distribution, which is just a two-dimensional version of the common Normal or Gaussian distribution.  It even uses the same parameter (sigma) to characterize the radial dispersion of shots on a target. BAC defines several classes of weapon accuracy based on the single Rayleigh distribution statistical parameter, σ (sigma), which is the Rayleigh analog of the standard deviation for Gaussian distributions. Each of the classes corresponds to a σ that is 1/10 of the designation of the class. In this way, Class 2 has a σ of 0.2, Class 4 has a σ of 0.4, and so on.

For a given weapon system (by which I mean weapon, ammunition, and shooting scenario), once σ is known, and thus the weapon class has been defined, all sorts of interesting information can be readily computed for the weapon.  For example, the Mean Radius (MR) of a class is approximately 1.25 times the σ parameter of that class. The MR is probably the most useful and easily understandable value to the shooter that can be computed from σ because it represents the EXPECTED, or most probable, distance of a given shot from the true point of aim.

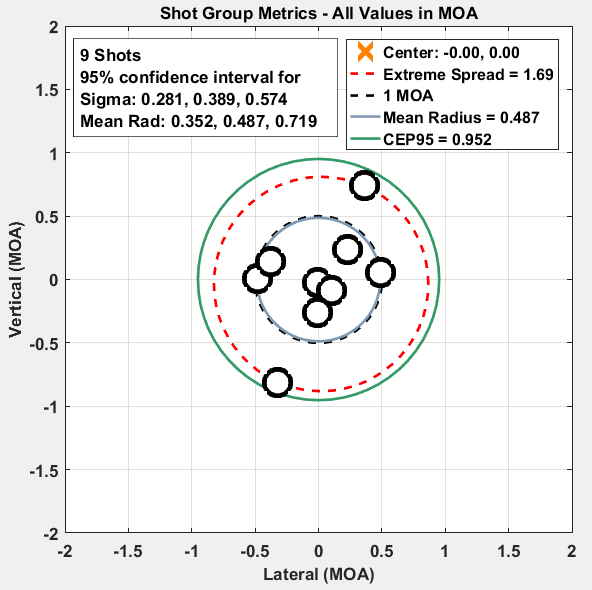
I introduce the term Accuracy Indicator to refer to some measure of a subset of a sample of a shot group, real or simulated, that conveys useful and/or interesting information about the accuracy of the weapon, ammunition, shooter, and combinations thereof, that were involved in shooting the group. Such measures as 3-shot and 5-shot extreme spread, mean radius, vertical standard deviation, horizontal standard deviation, group center, and Point of Aim error are all accuracy indicators.

One of my favorite accuracy indicators is the probability that a single shot will be equal to or closer than some distance from the true point of aim (POA) of the shooter.  I will call this indicator the P1x (probability 1 shot less than some x in MOA from true point of aim). The P1x accuracy indicator is practical and interesting for a lot of reasons, including that it is simultaneously its own mean and extreme spread. The P1x is also an inverse of the Circular Error Probable (CEP – i.e. the radius from the true POA for which a given shot is YY% probable, e.g. YY = 90 implies CEP90). While the true point of aim is never known perfectly to the shooter, the statistics reference the P1x indicator from the true POA, and the shooter would like their actual POA to equal the true POA.

CEPYY is computed from σ as

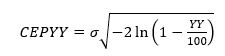
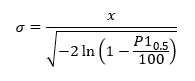
Which is easily inverted to get the P1x result for a given σ, or

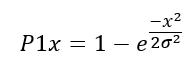
Where x is the distance from true POA in question. This can be solved for σ to answer another reasonable question: what σ and x will give me a P1x? For example, suppose we want to know what σ is needed to get a P1-0.5, which is the probability of a single shot landing within 0.5 MOA of the POA, with a probability of 80%. In this case solve for σ to get

With the result that
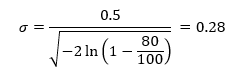
Which is Class 3.

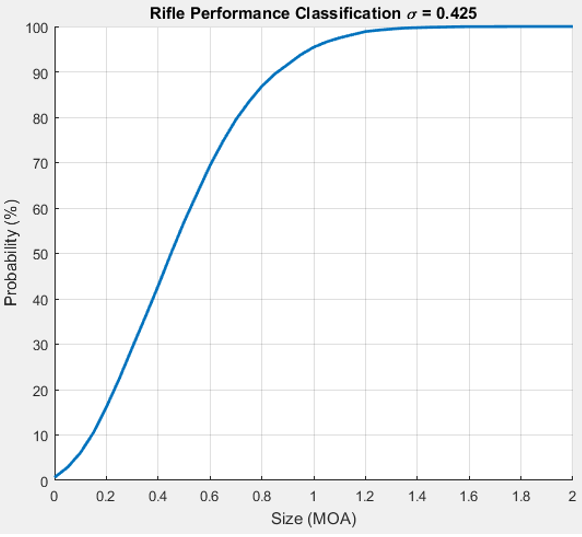
The reason I like this accuracy indicator so much is that it answers the practical question of whether the success of a proposed shot is probable, and exactly how probable. For example, I think most hunters will be happy if their hunting rifle had a P1-0.5 of at least 50%, meaning that the probability that a single shot will land within 0.5 MOA of the true POA is no worse than 50%. In this scenario, the hunter could reasonably expect to make 300 yard shots as the probability of the shot being within 1.5” of the intended target is 1 out of 2. Further, with a 50% P1-0.5, the P1-1.0 turns out to be much higher, 93.7% in fact, so that in our hunting rifle scenario, the hunter could expect a very good chance of their shot being within 3” of their point of aim at 300 yards (plus a small factor to account for discrepancy between true and intended POA). Such a weapon has a σ of 0.425 which puts it at the high end (lower is better) of Class 4 (Class 4 has σ centered at 0.4 and extends from 0.35 to 0.45). The following figure shows the P1x for x between 0 and 2 MOA for a σ 0.425 weapon.

Most rifle shooters, myself included, are inclined to think of accuracy in terms of 3 or 5 shot extreme spread. I will explore the usefulness of this metric as an accuracy indicator and compare with two other accuracy indicators: MR and P1x.

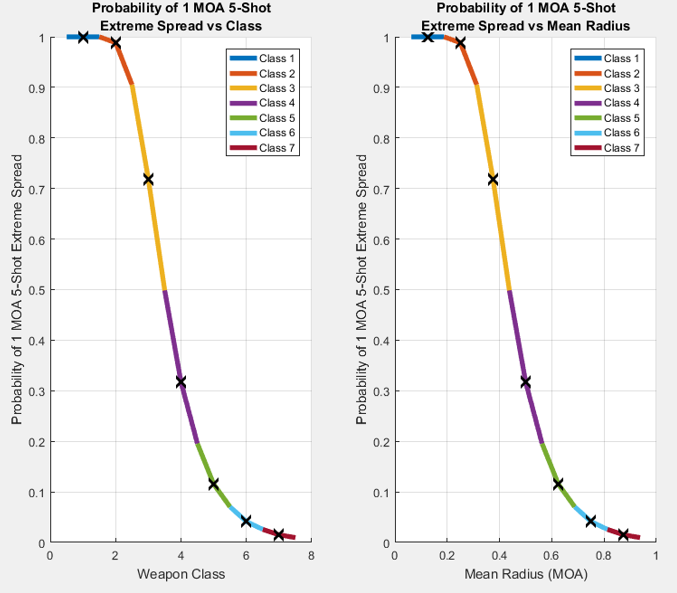
The figure below shows the probability of a 1 MOA or better 5-shot extreme spread (ES) for BAC classes 1 through 7. Note that the range of probability of 1 MOA or better ES is large for some classes (3, and 4) and small for most of the others (1 and 2 at the high accuracy range where the probability is greater than 90%, and 5-7 at the low accuracy range where the probability is less than 20%).

From the above notes and the graph below, it is my opinion that any BAC class that spans more than a 20% range of probability for a given MOA metric can be assumed to be of that ES class. In this case, BAC Class 3 and Class 4 can be reasonably thought of as MOA weapons. In this case, Class 3 is MOA with greater than 50% probability of 5-shot MOA groups while Class 4 is MOA with less than 50% probability of MOA ES. Classes 1 and 2 are what most of us think of as solidly sub MOA, and weapons at the low end of Class 3 are at the high end of sub MOA performance with a solid probability of 0.8 and 0.9 MOA or better 5-shot groups.

A natural question at this point is why not refine the classes so that classes 3 and 4 are broken up into finer regions on the 1 MOA plot? This is a very good question, and one I struggled with as I would like a more refined system as well. There turns out to be a very good answer: It is very difficult to determine the σ of a given weapon system to a finer degree than we are doing with the BAC system.

There are many reasons why this is true. Foremost, the number of shots required to define a BAC class more precisely than 0.1 MOA per class is very high, somewhere between 100 and 1000. Shooting so many shots starts to effect the accuracy of the rifle as the barrel you are shooting at the start of the session is not exactly the same as the on a the end of the session for a lot of reasons. Second, during a given shooting session, shooter fatigue will set in and start to have an increasingly larger effect on the results. There are other reasons but these are the most significant that immediately come to mind.

Class 5 is worth further consideration. It is not quite an MOA class according to the discussion so far but it is close. What happens if we extend the size of the 5 shot group under consideration from 1 MOA to 1.25 MOA?

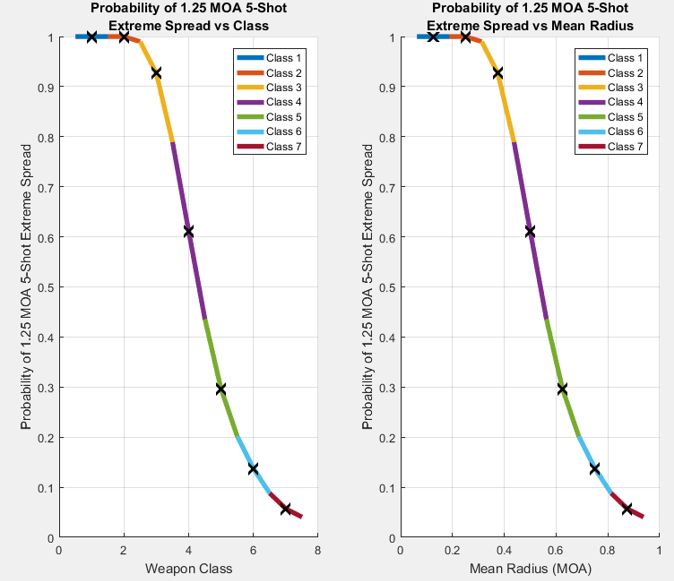
So, a Class 5 weapon can reasonably be considered a 1.25 MOA weapon when thinking in terms of extreme spread. How does a Class 5 weapon stack up in terms of P1-0.5 and P1-1.0 accuracy indicators? It turns out that for the center of Class 5 with σ = 0.5, P1-0.5 equals 39% and P1-1.0 is 86%. I consider this very good for hunting and informal target shooting.

On the other hand, I don’t like individual 3-shot groups for determining accuracy as they are statistically meaningless and they give a false sense of accuracy. Consider the probability of each class of weapon shooting a 3-shot extreme spread at 1 MOA or better:

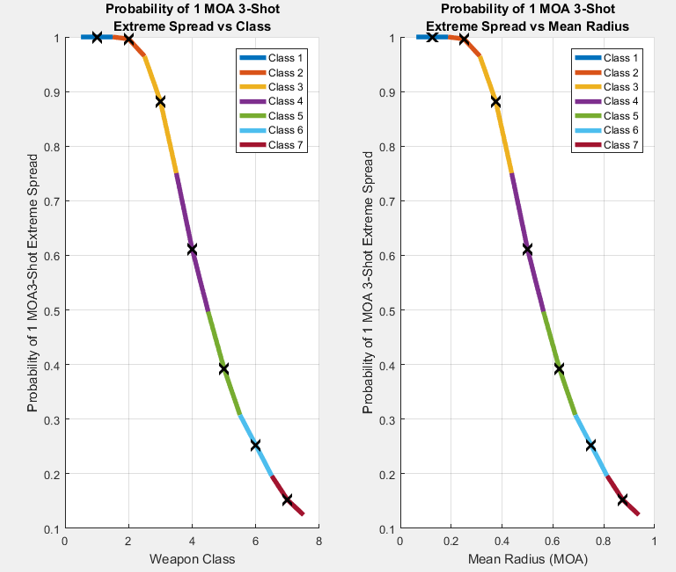
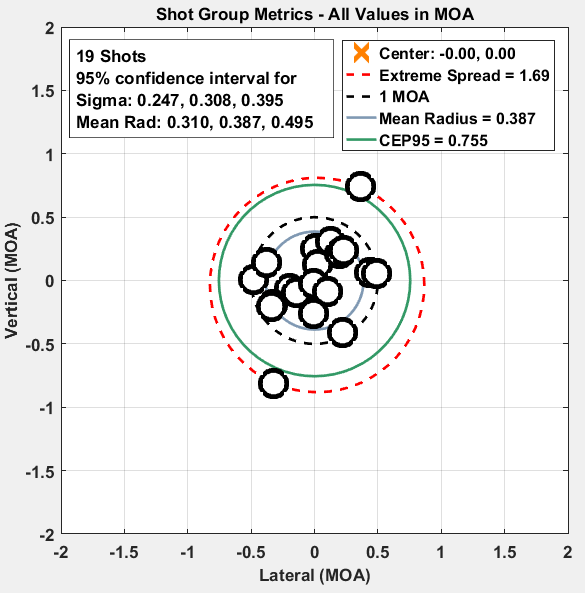
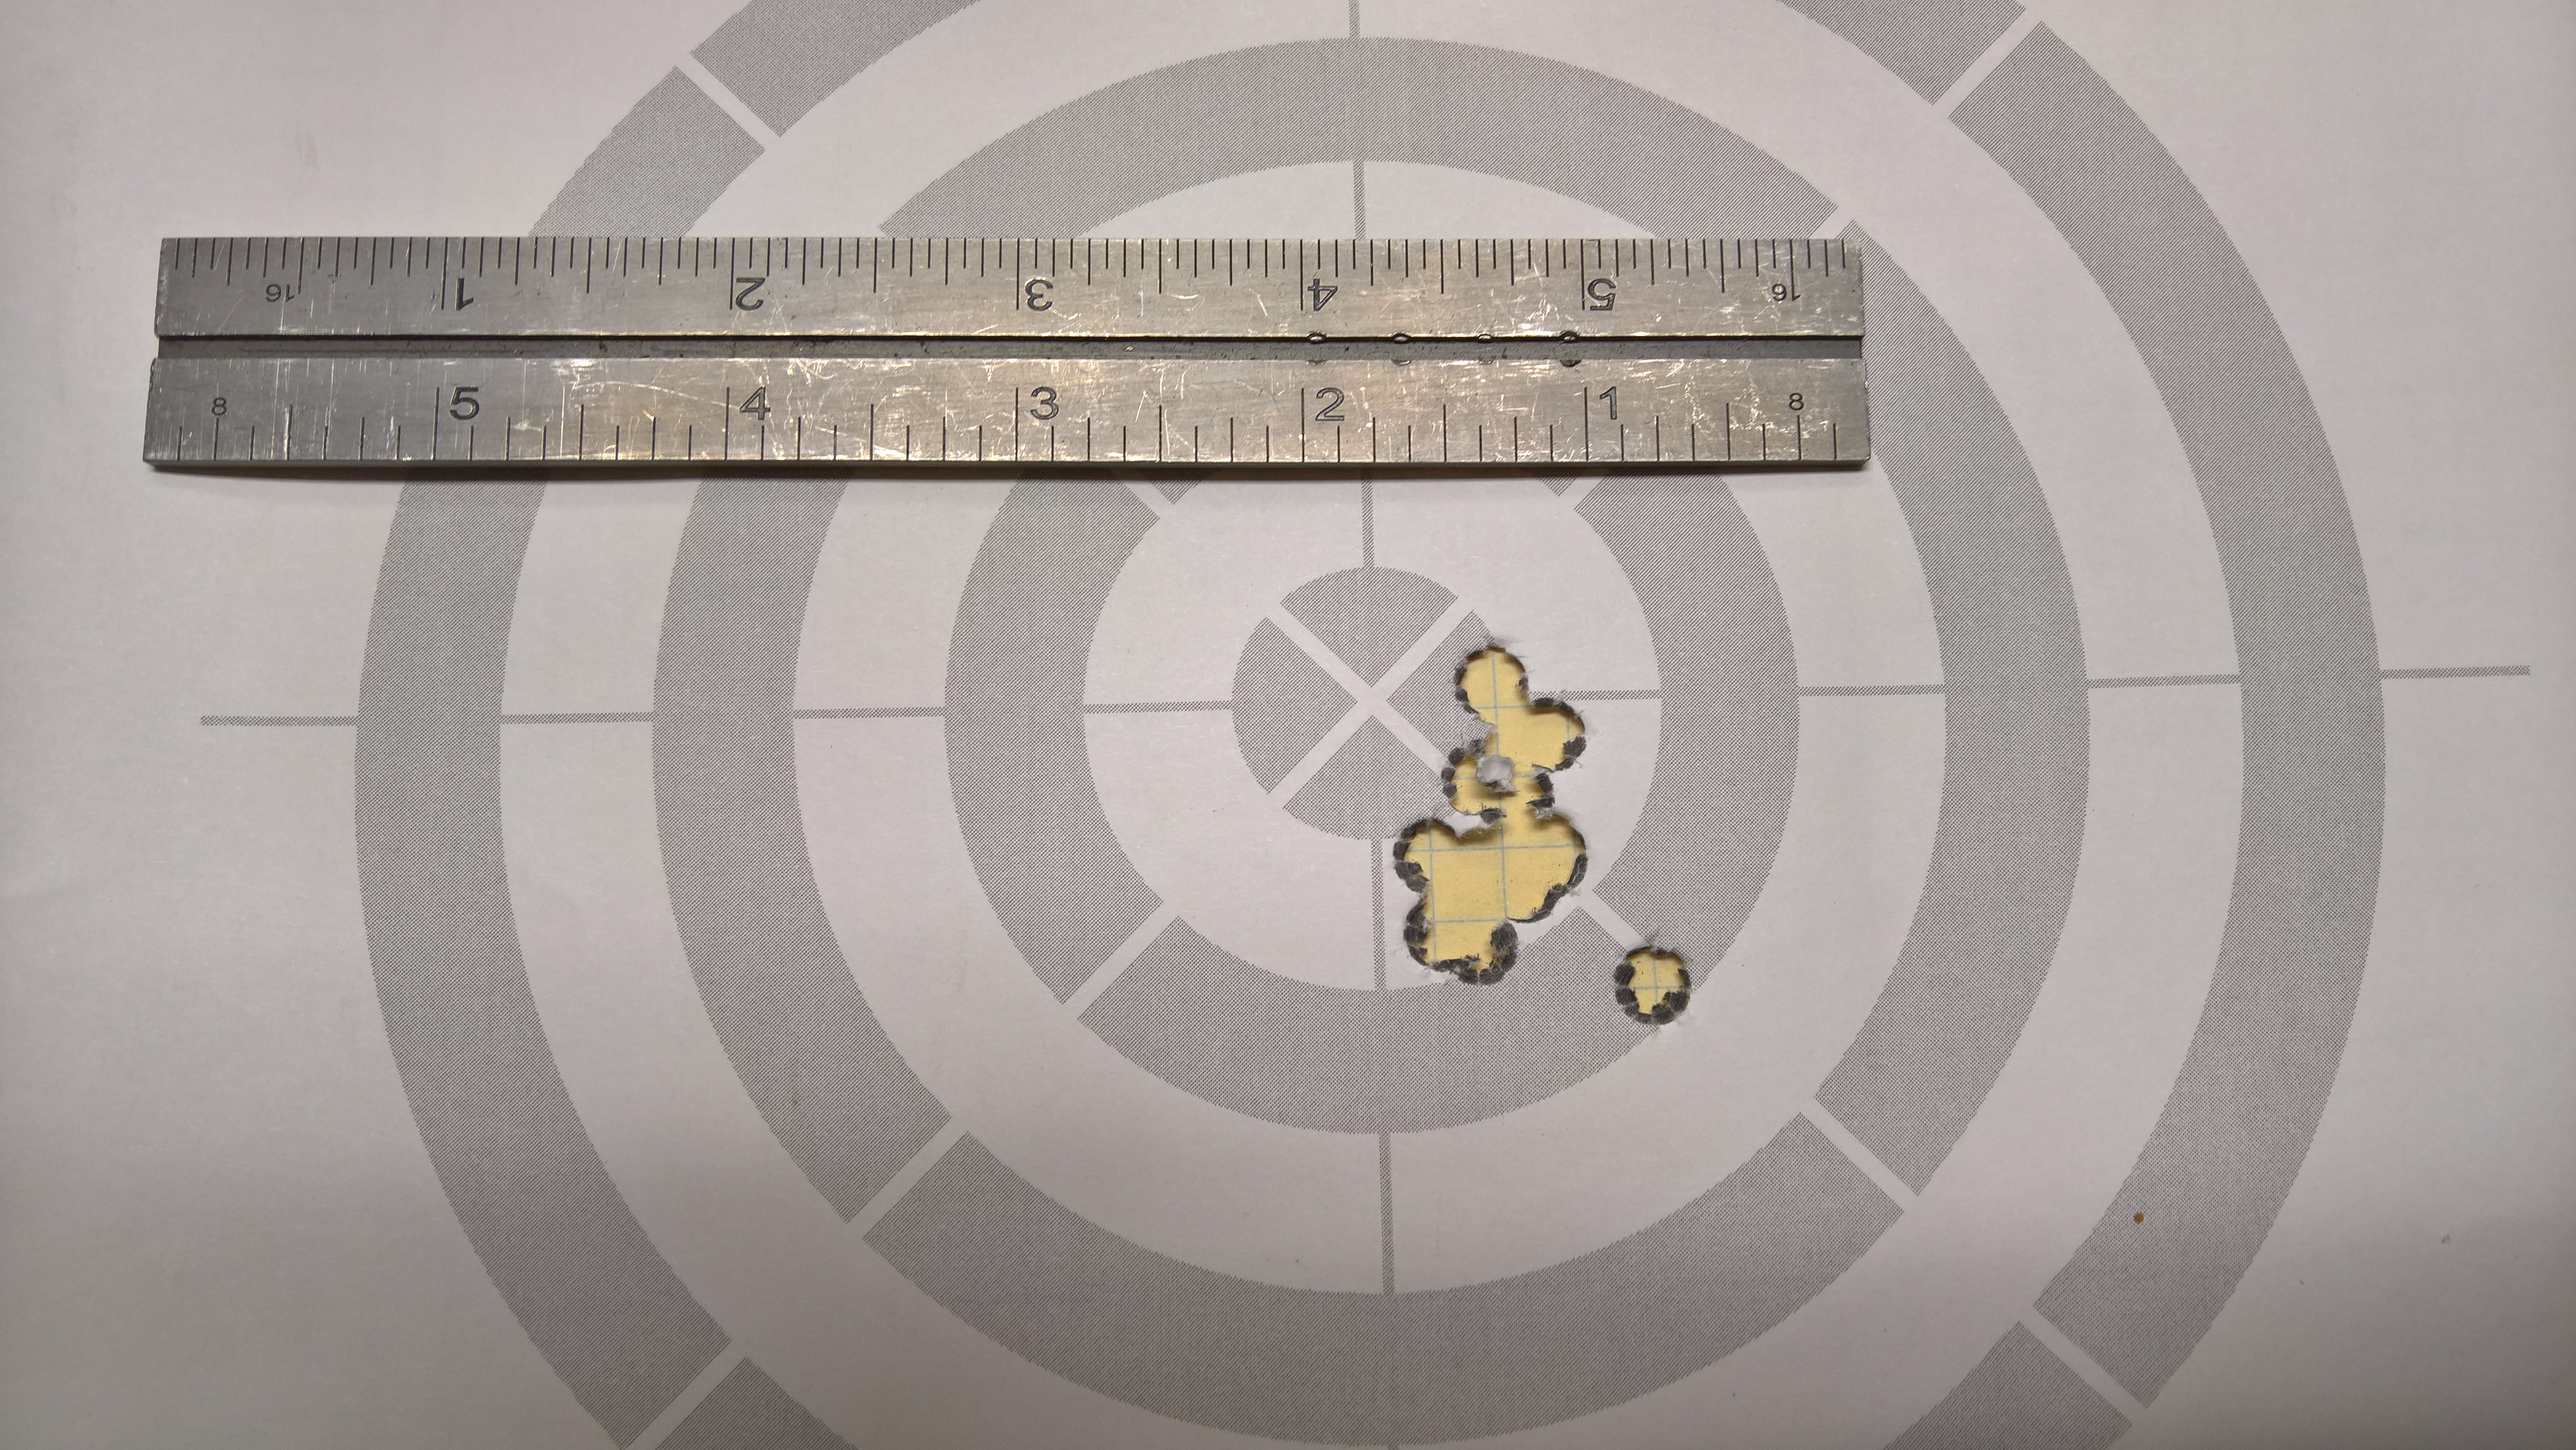
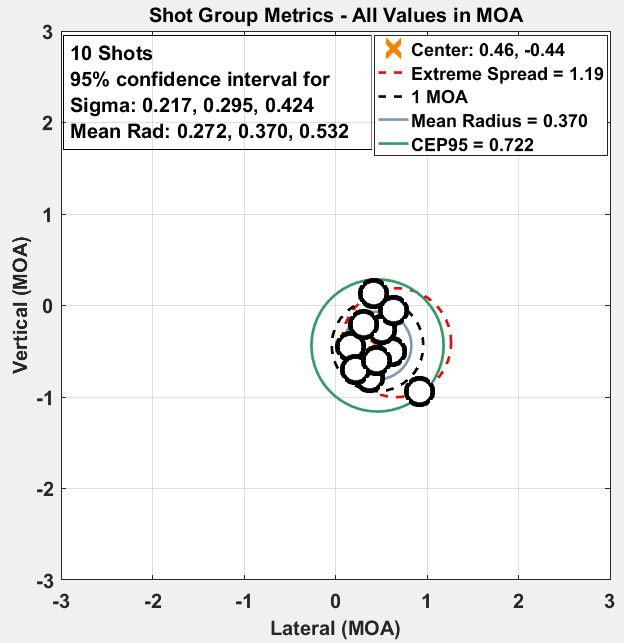
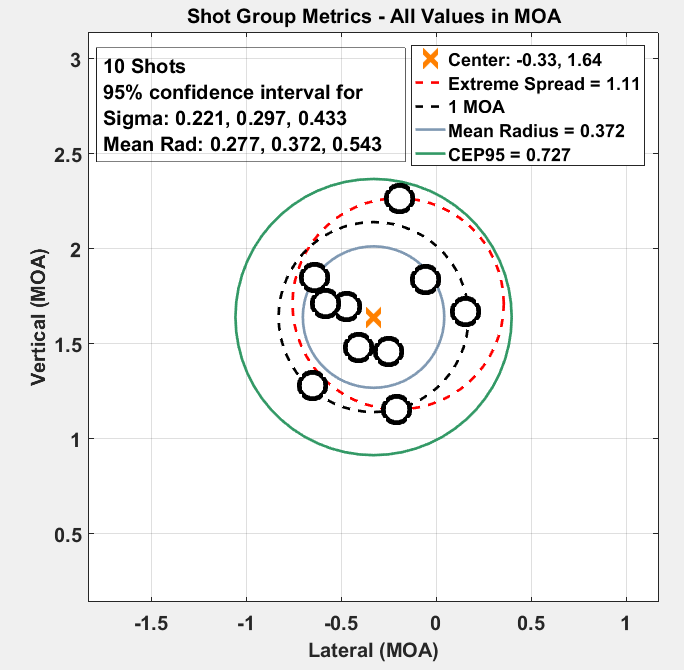
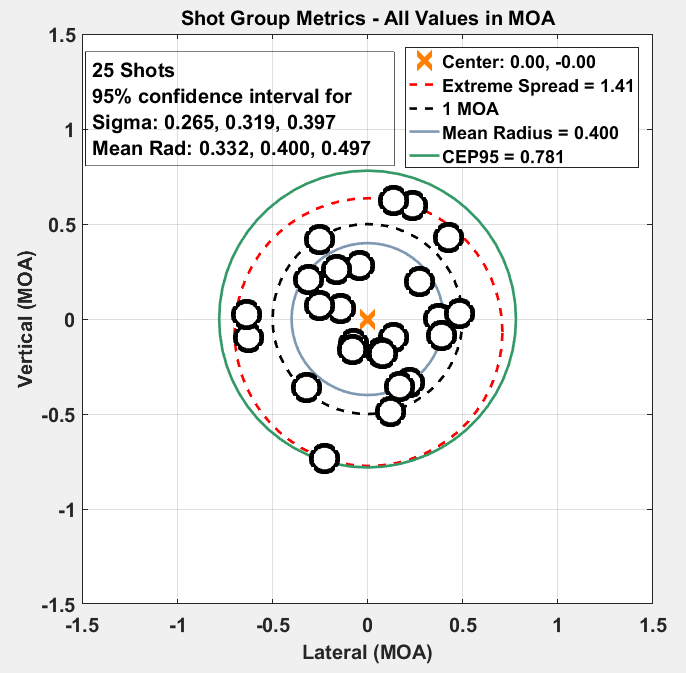
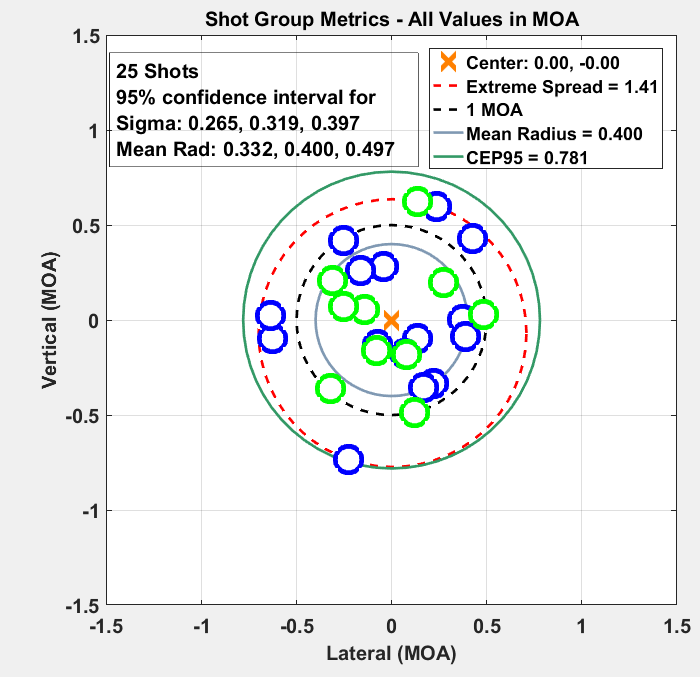
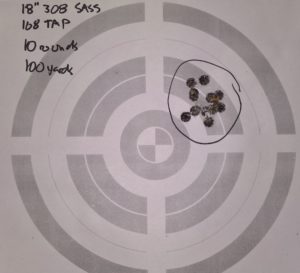
In this case, Class 5 is solidly an MOA performer as up to 30% to 50% of 3-shot groups are expected to be MOA or better. However, 3 shot groups for selecting ammunition that works well for a given rifle, or for zeroing a scope is a grave mistake, and for those and other reasons I reject 3-shot groups for any serious rifle evaluation. I know if feels awesome to have three shots in close proximity on paper, but take the extra courage and risk blowing the group for the greater good of knowing something closer to the truth. In fact, for serious accuracy determination, I shoot a minimum of 10 shots per group, and I usually combine data from three such groups into a single 30 shot result. I love 5 shot groups for fun and friendly competition, but for evaluation 10+ shot groups are vastly superior.

In my next post I will consider an important aspect of rifle shooting accuracy: the shooter. How can we estimate the accuracy of the shooter, and if this quantity is known, how can the accuracy of the rifle and ammunition be separated from the capability of the shooter with that weapon? Especially important to consider: how the precision of the shooter is effected by the weapon. Deficiencies in shooting technique are exaggerated by lighter weight weapons and cartridges with greater recoil, and the ratio between the two. Hold these thoughts until next time.

Accuracy Analysis

I’m going to start posting results of range sessions once or twice a month as we get our accuracy analysis up to speed. Right now the plan for a given weapon is 3 10-shot groups, so 30 shots total. Time between shots 30 to 60 seconds, 100 yards, mild conditions (hopefully), and the 3 10-shot groups will be taken with no scope adjustments so that they can be compiled into a single 30-shot group. Time between groups could be 5 to 30 minutes and is not deemed relevant, except that the barrel will have had a chance for substantial cool down.

The following image indicates what I hope to produce for these updates, which will be used to characterize a given barrel and weapon:


That 100 yard 10-shot group is just an example as I’m still working on presentation. The group was shot with one of our 18″ .223 Fulcrum barrels with 77gr Federal Gold Medal Match ammunition. In the future I plan to measure bullet velocity with with my LabRadar unit. The Sigma values  above indicate that this rifle and ammo combination is no worse than low Class 5, and probably Class 3. This is as much information as can be gleaned from 10 shots, which is one reason why 3-shot and 5-shot groups are dubious for gleaning weapon accuracy. I took 15 other shots with Hornady 75 grain match ammo and when both groups are centered and combined, just for example to get more shots in the group, I get the following retults:


In this case the Sigma value over a 95% confidence range tighten up from [.221, .433] to [.265, .397]. This indicates the rifle is no worse than Class 4, and could reasonably be Class 3 (especially given that I was the shooter and I’m not particularly good). Class 3 is realistically as good as auto-loading rifles get so this is the target, so to speak, for a competition gun like this one. For grins we can separate the two different groups and overlay to see how the different ammo shot:

I didn’t measure muzzle velocity of any of the shots, but that is planned for future analysis. In the future we can tag any given shot with a muzzle velocity and then analyze the results.

The important takeaway is that it takes a lot of shots to properly characterize weapon accuracy, and that even with a lot of shots, the accuracy potential of the weapon is hard to nail down with a lot of precision. Still, were confident that we can back up our Class 5 guarantee on our products, and that we’ll be able to zero-in on that number a lot better with more data.

Truth in Accuracy

Countless times I am asked and have asked the question that arguably troubles rifle shooters more than anything: “How accurate is my rifle?” Most shooters, myself included, have settled on 3 or 5 shot groups, and the expected extreme spread of that group. We like to buy rifles that promise groups that are 1 inch or 1 MOA. We take our shiny new weapons to the range and put the manufacturer’s guarantee to the test.

The after-action report finds us sometimes pleased and sometimes not. We all know a single bad range trip can be due to lack of sleep, too much coffee, a bad batch of ammunition, ammunition the weapon simply doesn’t like, or one of many other excuses. These excuses might be legitimate, but there’s no way to know. Adjustments are made, bullet seating depth is changed, different ammo is selected. The next range trip might produce a couple groups in the MOA to sub MOA range and we are then pleased that our rifle is indeed a shooter and we pack up happy until next time.

Then we get really sophisticated, especially if we are hand loading our ammunition. 50 rounds, in a blue plastic box, the first 5 sets of 5 rounds varying powder charge by a few tenths of a grain, the second varying bullet seating depth. We shoot our 10 groups and look for trends, and we see the groups open up or close down in a manner that appears to vary proportional to the change in the parameter of interest. And who doesn’t love a good looking target after a trip to the range.

I’d seen some interesting measurements of group statistics that got me thinking. Extreme spread was never completely satisfying from a practical point of view, and achieving a small extreme spread had become more like winning a football game than providing meaningful feedback about the outcome of a shooting session. Here’s where things could have gone one of a couple different directions. If I were to keep on keeping on, business as usual, keep chasing MOA and sub-MOA 5-shot groups with extreme spread as the metric, I start to run the risk of fooling myself. Fliers are the shooters equivalent of Mulligans in golf, and we use “called fliers” as a means to tighten up the group size. I find called fliers very unsatisfying and if the group didn’t stay together, it didn’t stay together and that was that. Still, not enough useful information.

Not surprisingly, all these shooting sessions, all this data, and it’s clear there’s more meaningful information. The problem of measuring shooting accuracy clearly has a statistical nature, and concepts like mean and standard deviation, already long in use when thinking about muzzle velocity, must be applicable in some way. The internet knows everything and Bing searches quickly lead to Ballistipedia. Go there and you will find the application of some serious statistical expertise to the problem of thinking about and measuring rifle accuracy. The problem turns out to be a lot more complicated and nuanced than I thought.

Once I got through my five stages of grief, having given up the old and beloved way of thinking about accuracy, serious study of the proper way to analyze the measurements of little holes in paper began. It took me a couple months of part time study, but I finally gained a good understanding of the statistics of measuring rifle accuracy. The problem is complicated and I think the subject is not one that is suitable to most shooters who just want to know the practical accuracy of their weapons so they can be aware of what shots are reasonable for them to take, and what is the probability of a given outcome.

Getting back to the beginning of this post, as a company that sells rifle barrels and components, we want to be able to tell our customers what level of accuracy they can expect from our products. Now we know there is no meaningful answer to the question “Will my rifle shoot MOA groups?” The hope is for a sea-change in the way rifle accuracy enthusiasts think about and discuss their topic. The methods presented at Ballistipedia are correct but not generally accessible, and the practical implications of the results of detailed statistical analysis of shooting data are hard to discern. A system is needed that boils down the results of the statistical analysis of a sample of shooting data into different classes of performance. Once a weapon and ammunition combination has been classified, the shooter can easily assess the likelihood of a particular outcome of a hypothetical scenario. The shooter can know how likely they are to shoot a 5-shot group with MOA or better extreme spread. They can also know the probability of any given shot being within 1/2″ from the true point of aim. They can also know how many shots are needed to get a good estimate of the true point of aim of their weapon so that they can achieve a good zero for their scope.

To this end, Bison Armory has worked with Ballistipedia.com to create the Ballistic Accuracy Classification system.

We are still working to classify our barrels, upper assemblies, and rifles, but to start we guarantee that our products are at least Class 5 as defined in the BAC system. In practical terms, this means a shooter can expect at least 39% of their shots to fall within 1/2″ of the true point of aim, 9% of 5-shot groups to measure 1″ or better extreme spread, and 35% of 3-shot groups will achieve this measure. Our data indicates that our products are probably typically Class 4 but we’ve not gathered enough data yet to make a guarantee i this regard. For Class 4, a shooter can expect 54% of their shots to fall within 1/2″ of the true point of aim, and 26% of 5 shot groups will have a mean radius of 1″ or smaller, and 57% of 3-shot groups will be this small.

Our match grade, heavy barreled, and Fulcrum products should approach or achieve Class 3 status with the right ammunition. Of course, the true classification of a given barrel in practice will depend on the quality of the build, the ammunition used and its suitability to the weapon, the setup and performance of the shooter, the trigger, the total weight of the weapon, the quality of the optics, the tightness of the fit between upper and lower receiver, and other factors.

Once you know the class for your weapon, you can know with confidence important metrics like the probability of hitting a given target at a given range with a single shot.
No other rifle manufacturer we know of goes to these lengths to give a meaningful accuracy guarantee for their products. It takes time, it takes commitment to the truth above marketing, and it takes dedication to rifle shooting as a discipline. Don’t be fooled by phony accuracy guarantees. Demand the truth, embrace the truth, and then every shot will count.

Bison Armory Shim Set Instructional Video

We’ve created a new instructional video that you can use to help with the installation of Bison Armory barrel nut shim sets. You can purchase shim sets at our web store HERE, which will help you get perfect alignment and torque when installing your AR-15 barrel. Our shim set works with any AR-15 barrel nut that requires correct alignment. The instructional video is featured on YouTube and we’ve embedded it below:


New SHIRTS are here!

Our new line of shirts is here just in time for summer – available in sizes Large, Extra Large, and Extra-Extra Large! These are olive green “Hanes Beefy Tee” cotton shirts, with the Bison Armory logo in white on the front, and a 4 color graphic on the back – with the bullets done in proper bullet colors! Here’s a link to the product page: http://bisonarmory.com/bison-armored-shirt/

medium new shirt
Perfect for Cougar watch in the driveway… seriously, we had a cougar in the driveway a few months ago!
IMG_3489 (547x640)
Back graphic detail
IMG_3496 (640x157)
Front graphic detail

NEW: Bison Armory 16″ .223 Wylde Barrels

Bison Armory is now selling our great shooting .223 Wylde barrels on our web store here. These barrels are made from 416 stainless steel, button rifled with 1:7 twist 6-groove rifling, and have .223 Wylde chambers, which means they handle .223 Remington and 5.56 NATO ammo equally well.

Our current offering is a 16″ Recon profile barrel that is capable of MOA performance. Starting at $160, these barrels can’t be beat on price for performance. These barrels are in stock now and ready to ship.

6.8 SPC vs 300 AAC Blackout – Grudge Match

TommyRyan-JimmyDevine-4

The latest grudge match in the tactical and sporting rifle world is heating up between two relatively new calibers: 6.8 SPC and the .300 AAC Blackout (“BLK”). We here at Bison Armory evaluated the BLK to see how it stacks up against the 6.8 SPC cartridge. We considered (1) what the BLK offers to the tactical rifle market and (2) whether it does anything better than the 6.8 SPC. Based on these criteria, we came to the conclusion that the BLK underperforms the 6.8 SPC where it really counts. And here’s why:

1. Parts Compatibility with .223 AR-15

Winner: 300 BLK

The 6.8 SPC and BLK both share good parts compatibility with .223 Rem / 5.56 NATO AR-15 rifles. Conversion to 6.8 SPC only requires the install of a caliber specific barrel, bolt, and magazine. BLK conversion, on the other hand, simply requires the install of a caliber specific barrel. Not only does this save a few bucks, but it means BLK rifles are PMag compatible. So the BLK takes this round.

2. Subsonic Rifle Operation

Winner: 6.8 SPC

Unlike the BLK, 6.8 SPC subsonic ammunition does not require both the use of a pistol length gas system and a silencer for your rifle to operate reliably with a 16″ barrel. With a 16″ barrel, 6.8 SPC subsonic ammunition loaded with 200 grain bullets will cycle and lockback the action with a carbine length gas system without a silencer. In high stress situations you want your rig to run whether or not you have a silencer attached. If something happens to your can, or for some other reason you cannot run suppressed, do you really want to be hand cycling your rifle in the heat of the moment? This is clearly an important win for the 6.8 SPC subsonic.

3. Subsonic Ammo Performance

Winner: 300 BLK

The 220 grain and 240 grain 300 BLK subsonics have 10% to 20% more muzzle energy, respectively, than the 200 grain 6.8 SPC subsonic at the muzzle. This is not a huge difference, but the BLK has the advantage.

4. Supersonic Ammo Performance

Winner: 6.8 SPC

Performance in this category is measured in terms of bullet velocity, energy, and drop as functions of range. We will compare the Sierra 115 grain Match King .277 for the 6.8 SPC with the Sierra 125 grain Match King .308 for the 300 BLK for an apples to apples comparison. Bullets are available for both rounds with higher BC’s and so forth, but to keep things simple we’ll work with the Sierra MK bullets.  Ballistic coefficients are available directly from Sierra here. These are G1 ballistic coefficients and we’ll stick with that for sake of simplicity.

To start, the 115 SMK .277 has a ballistic coefficient of 0.317 for velocities between 1800 and 2400 fps, and the muzzle velocity of the round is assumed to be a relatively tame 2500 fps. The 6.8 SPC can be driven harder than this but, to be conservative, we’ll stick with 2500 fps out of a 16″ barrel.

The 125 SMK .308 has a ballistic coefficient of 0.338 between 2000 and 2650 fps and 0.330 below 2000 fps. For this comparison the higher BC will be used to give the BLK as much advantage as possible. The muzzle velocity from a 16″ barrel of 2215 fps direct from AAC will be used as well for this comparison.

The following chart shows the muzzle velocity from 0 to 500 yards using the Hornady Ballistics Calculator. velocity

Muzzle velocity by itself doesn’t say much about the performance of a cartridge, except that higher muzzle velocities tend to equate with flatter shooting. So next we will look at bullet drop vs range:

drop

Both rounds are set to 100 yard zeros for comparison. There is not much difference between the trajectory of the two rounds until about 200 yards, at which point the difference in drop is only 2 inches. At 300 yards the difference is 6 inches, and at 400 yards the difference opens up to almost 13 inches. At 500 yards the difference is approximately 2 feet. The 6.8 SPC and 300 BLK are very similar to 300 yards, but past that the 6.8 is clearly superior in terms of bullet trajectory.

energyBullet energy is the best performance comparison of the three metrics considered here. The 6.8 SPC starts at the muzzle with 8.5% more energy than the 300 BLK. This advantage is maintained downrange to 300 yards, and the 6.8 SPC still has 3% more energy than the 300 BLK at 500 yards. Combined with the flatter shooting of the previous figure, which round are you going to want for 3-gun, hunting, or combat/tactical use?

The 6.8 SPC is the clear winner in this category.  Who says you can trust my analysis? Apparently AAC does as they quoted my work on page 27 of this document.

5. Ammo Cost and Availability

Winner: Tie

Cost is more or less the same, and there are more varieties of 6.8 SPC available than 300 BLK on Midway USA. However, there is no commercially loaded 6.8 200 grain subsonic yet available, but there will be in the near future. So I call it a tie.


Overall Winner: The 6.8 SPC takes it.

While the 6.8 SPC and 300 BLK each win two of five categories with one category resulting in a tie, the 6.8 SPC won the title for best supersonic ammo performance. Supersonic ammo performance is, in my opinion, a more important category than the others, and where the 300 BLK had victories, the margins were narrow. Therefore the 6.8 SPC wins the grudge match in my opinion. Does this mean that the 300 BLK is a bad round, or that it isn’t an effective round for hunting, competition, or defense? Of course not. Both the 6.8 SPC and the 300 BLK outclass the 5.56 NATO in most categories, and both will serve their users well. Our goal is simply to cut through the hype.

Notes on Bison 6.8 SPC Subsonic

Lob

Just a couple of quick notes on the Bison Armory 6.8 SPC subsonic platform (AKA 6.8 BSP).

1. A 16″ Bison 1:7 twist barrel with carbine length gas will cycle 180 and 200 grain subsonic ammunition WITHOUT a silencer. This includes bolt lockback on the last round in the magazine.

2. All Bison 1:7 twist barrels will handle all commercially available 6.8 SPC ammunition, including SSA Tactical loads.

3. Field testing has shown no difference in accuracy between the 1:11 twist 16″ recon and 1:7 twist 16″ recon. Reports from customers have indicated that the 140 Sierra Game King performs extremely well when loaded supersonic in the 1:7 twist barrel, especially for ranges beyond 200 yards.

4. Shooting subsonic with or without a silencer is fun. Without a silencer we still recommend hearing protection, but simple ear plugs will do, recoil is minimal, blast is diminished substantially, all of which makes it a great back yard plinker, especially for the kids. The only draw back is the ammunition cost of the subsonic rounds.

Conclusion: Go Bison 6.8 SPC subsonic!