On April 4, 2015, the Firearm Blog’s Nathaniel F Posted a very interesting article titled “Not So Special: A Critical View Of The 6.8mm SPC“. The article presents a critical review of the 6.8mm SPC cartridge and an extensive comparison with both typical and high performance .223 / 5.56 NATO ammunition. The results of the comparison indicate that the 6.8mm SPC cartridge cedes too much in terms of trajectory and velocity to modern offerings in 5.56 NATO to make up for what it gains in projectile energy at range. In summary, Nathaniel F finds that the 6.8mm SPC is useful for medium game hunting at modest ranges, and not much else.
At Bison Armory, we have a special affinity for the 6.8mm SPC cartridge, and so I have studied Nathaniel F’s article and I present here a critical response to his excellent and generally well considered article.
For the purposes of this review of Nathaniel F’s article, I will only consider factory ammunition and not hand loaded ammunition to simplify the discussion.
Historical Review
Nathaniel F’s article (I’ll refer to it going forward as “NFA”) begins with a brief history of the development of the 6.8mm SPC cartridge (6.8 SPC). This historical review is excellent and I have nothing more to write about it, except to say that if you are interested in the 6.8 SPC, this historical review, with links, is a good place to start.
6.8 SPC case geometry and projectiles
NFA provides good information regarding the case information including parent case, case taper, shoulder angle, case length, and case capacity. No quibbles here. NFA then mentions projectile selection:
It uses standard .277″ diameter projectiles, although it is limited in its selection of those by the overall length. In general, though the projectile diameter is the same, the 6.8mm Remington requires totally new projectiles versus existing .270 caliber rounds
This is not entirely true. Existing .270 caliber rounds, such as the 130 grain Berger VLD and 130 grain Woodleigh PPT are suitable for hand loading. But in general, this claim is fair.
Further:
It is very curious to me that a round that was designed with an accurized designated marksman’s rifle in mind also features such a short ogive and low muzzle velocity. Typically, medium/long range precision weapons platforms place a premium on both the ballistic coefficient and velocity of the projectile, seeking to obtain as laser-like a trajectory and as high a retention of energy as possible. The 6.8mm SPC runs directly counter to this.
And:
In light of this, the 6.8mm SPC’s maximum ogive length is the first curiosity of the cartridge’s design. With only 2.07 calibers available space for the ogive, the maximum ogive length for the 6.8 SPC is less even than that of the 5.56x45mm or 7.62x39mm cartridges.
Here’s where I begin to quibble with Nathaniel F’s piece. Does he mean the maximum length in terms of calibers or inches? The .223 Rem / 5.56 NATO has a 0.5″ of space available for the ogive, which is 2.23 calibers, while the 6.8 SPC has 0.574″ or 2.07 calibers. This presumes loading to SAAMI / NATO specifications which limit the OAL of both cartridges to 2.26″. Next:
This is very short for a rifle cartridge designed for maximum performance out to 450 meters, and limits the form factor of compatible secant-ogive projectiles to above 1.15 i7 (lower form factors yield higher ballistic coefficients), with tangent ogive projectiles having form factors as high as 1.32 i7. For comparison, the M855 projectile offers a 1.166 i7 form factor, despite not being particularly well streamlined. Finer projectiles compatible with the 5.56mm round offer i7 form factors as low as 1.09. Even when magazines allowing longer ogives are used – which it should be noted also would allow the use of longer and finer 5.56mm projectiles – the available relative space is still not significantly greater than that of the 5.56mm and 7.62x39mm cartridges. Further, as of yet there do not seem to be any manufacturers making .277″ projectiles with ogives designed for these longer magazines, and thus they only offer a velocity advantage to handloaders seating existing short-ogive bullets less deeply in the case.
This is a lot of blather. Form factor (or Coefficient of Form) is a very useful coefficient for describing the aerodynamic drag that acts on a bullet in flight, more useful in some ways than the ballistic coefficient. If you don’t understand the importance of form factor to ballistic performance, or how it relates to BC, I suggest a quick read of this article by Brian Litz at Berger Bullets. I think the previously quoted paragraph contains a lot of blather because statements like “This is very short for a rifle cartridge designed for maximum performance out to 450 meters,” are misleading. The idea of “maximum performance” is meaningless without providing a measure of optimality. This would in turn imply a cost function, and none is provided. This is unfortunate because the history of the 6.8 SPC provided near the beginning of the article clearly states the objectives of the cartridge program:
… to develop a new capability that would increase incapacitation, lethality, and range over the existing 5.45x39mm, PRC 5.8x39mm, 7.62x39mm and 5.56x45mm NATO cartridges.
…
Once all the performance data were compiled the team briefed the Commander on the results, and recommended that the 6.8mm [of the 6.5mm, 6.8mm, and 7mm projectiles considered to be combined with the 30 Rem parent case – ed.] provided the best overall terminal, reliability and accuracy performance out to 450 meters.
I don’t notice anywhere in the terse history provided in the article a requirement of a nebulous “maximum performance out to 450 yards.” I will put the actual statement of purpose to the test later on. So the loaded opening sentence about the purpose of the 6.8 SPC cartridge leads us into the rest of the paragraph which seems reasonable but is guilty of a serious error or omission of fact: The claim that projectiles for the 6.8 SPC are limited to form factors above 1.15 is simply false. This table summarizes form factors and ballistic coefficients for several 6.8 SPC specific projectiles and the 77 grain SMK for comparison:
Bullet Weight (gn) Diameter (in) SD G1 BC G7 BC i7
Sierra MatchKing 77 0.224 .219 .362 .185 1.184
Nosler Accubond 100 .277 .186 .323 .165 1.127
Nosler Accubond 110 .277 .205 .370 .191 1.073
Hornady BTHP 110 .277 .205 .360 .186 1.102
Sierra MatchKing 115 .277 .214 .324 .167 1.281
Hornady SST 120 .277 .223 .400 .207 1.077
77 grain SMK G1 = 0.362, G7 = 185, i7 = 1.184.
100 grain Nosler Accubond G1 = 0.323, G7 = 0.165, i7 = 1.127.
110 grain Nosler Accubond G1 = 0.370 , G7 = , i7 = 1.073.
110 grain Hornady BTHP G1 = 0.360, G7 = 0.186, i7 = 1.102.
115 SMK BTHP G1 = 0.324, G7 = 0.167, i7 = 1.281.
120 grain Hornady SST G1 = 0.400, G7 = 0.207, i7 = 1.077.
I don’t know where Nathanial F. got his data, but he needs to check his numbers. All of the above bullets were available and in use in commercially produced ammunition at the time of his writing from Silver State Armory, Hornady, and others.
Further, as of yet there do not seem to be any manufacturers making .277″ projectiles with ogives designed for these longer magazines, and thus they only offer a velocity advantage to handloaders seating existing short-ogive bullets less deeply in the case.
Several bullets are available that can be loaded to SAAMI case length or up to magazine length for the longer PRI, Magpul/LWRC, and C-Products magazines. Cavity Back Bullets has two different 120 grain bullets with high ballistic coefficients (.365 G1 hunting bullet and .400 G1 target/tactical bullet). The .400 G1 120 SST can be loaded long for increased muzzle velocity, as can the .370 G1 110 Accubond. Ammunition made with Berger 130 VLD bullets must be loaded to an OAL that requires the longer magazines. 120 to 130 grain bullets from Nosler, Cutting Edge Bullets, and others can be used as well.
Additional Metrics
The next few paragraphs find NF looking for any metric he can use to show that the 6.8 SPC doesn’t measure up to the 5.56×45 cartridge. Many of these numbers may be worth considering from a design point of view, but the 6.8 SPC is no longer in design phase; it is now an actual cartridge and there’s little point comparing design parameters when we can compare actual ballistics performance. Hence, I call foul.
I don’t plan to address the following information provided by NFA except to express my emotional displeasure with the topics:
Fineness ratio, bleh
Relative capacity, bleh
Powley computer bunk, bleh
The NFA article refers to MK262 running at 68kpsi, to which I says pardon? NFA refers to “more thermally stable propellants, but link is broken and what is he talking about? Another link to the material is here:
https://ndiastorage.blob.core.usgovcloudapi.net/ndia/2006/smallarms/faintich.pdf
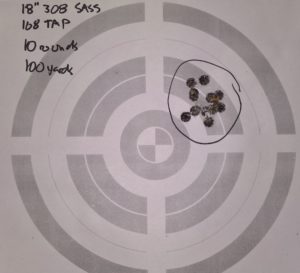
Claims 2800fps from 18″ barrel, maybe on a hot day. Black Hills claims 2750fps and a recent trip to the range on a 50 F day found 2722 fps from an 18″ barrel and 2790 fps from a 20” barrel. So I find some exaggeration in the velocity claims made in the article.
NFA also makes up a metric called “internal specific energy” that is admittedly “not generally used in the relevant literature.” Bleh.
Bolt Thrust
NFA considers bolt thrust, because if he can find a problem with the 6.8 SPC he’s going to report it. He explains that the 5.56 NATO produces 5432 lbf bolt thrust while the 6.8 SPC produces 6537 lbf, and concludes:
The 6.8mm SPC round evidently puts much more stress on the rifle’s bolt than the 5.56mm round, which may cause the bolt to break sooner.
To which I reply: I’ve sold thousands of 6.8 SPC bolts, barrels, upper assemblies, and rifles, and I’ve yet to have a customer report a failure of a bolt that could be attributed to bolt thrust. Ugh. Again, real world vs design metrics crush his arguments. Naturally the 6.8 generates more bolt thrust than the .223 Rem because F = ma and K = 1/2mv2, , i.e. physics, and the 6.8 SPC has significantly higher kinetic energy at the muzzle than the 5.56 NATO. The question is really: “Can AR-15 bolts manage the bolt thrust associated with the higher power cartridge?” The data I have available replies with an incontrovertible “yes.” The consideration of bolt thrust is interesting but really results in little difference between the two cartridges.
External Ballistics
For a proper comparison of the performance of the 5.56 NATO with the 6.8mm SPC, external ballistics are where the rubber meets the road. NFA begins with a comparison of one of the lamest 6.8 bullets from a terminal performance point of view, the Sierra 115 MatchKing. This bullet is very stubby, has a low G7 BC, and high form factor. This was one of the earliest 6.8 SPC specific bullets and it shows. Comparing this bullet to the 77 grain .224 SMK in the MK262 may seem like apples to apples, but it really is not.
NFA also compares Hornady BTHP bullets, specifically the 75 grain .224 vs the 110 grain .277. In this case the 6.8 fares somewhat better but the results presented indicate little advantage in retained energy of the 6.8 at range, and inferior trajectory and velocity. NFA calls the 6.8 SPC performance “Lackluster,” but is it really? He gives the 110 grain Hornady BTHP a BC of 1.8 when 1.86 is probably more accurate. He increases the velocity of the 6.8mm Hornady round to 2660 fps while also increasing the velocity of the 75 grain Hornady BTHP to 2840 fps. I think he is giving preference to the 5.56 NATO numbers here and not being as objective as he could be. The 75 grain Hornady would produce about 2837 fps if we equate energy of the 77 SMK with the 75 BTHP. However, my range testing, along with the stated muzzle velocity for an 18″ barrel for the MK262 from Black hills, indicate that 2750 fps is more realistic. Hence, a more realistic value for the 75 BTHP is 2785 fps.
NFA external ballistics analysis included comparison of velocity, drop, and energy. To that I am adding optimal game weight (OGW), which is a dubious metric if used in isolation, for projectiles of dissimilar size (i.e. pellets vs baseballs), and without consideration for bullet construction and purpose. However, OGW for comparison of similarly constructed bullets in a range of calibers in which the smallest is not less than 70% of the largest (e.g. comparing .224 to .308).
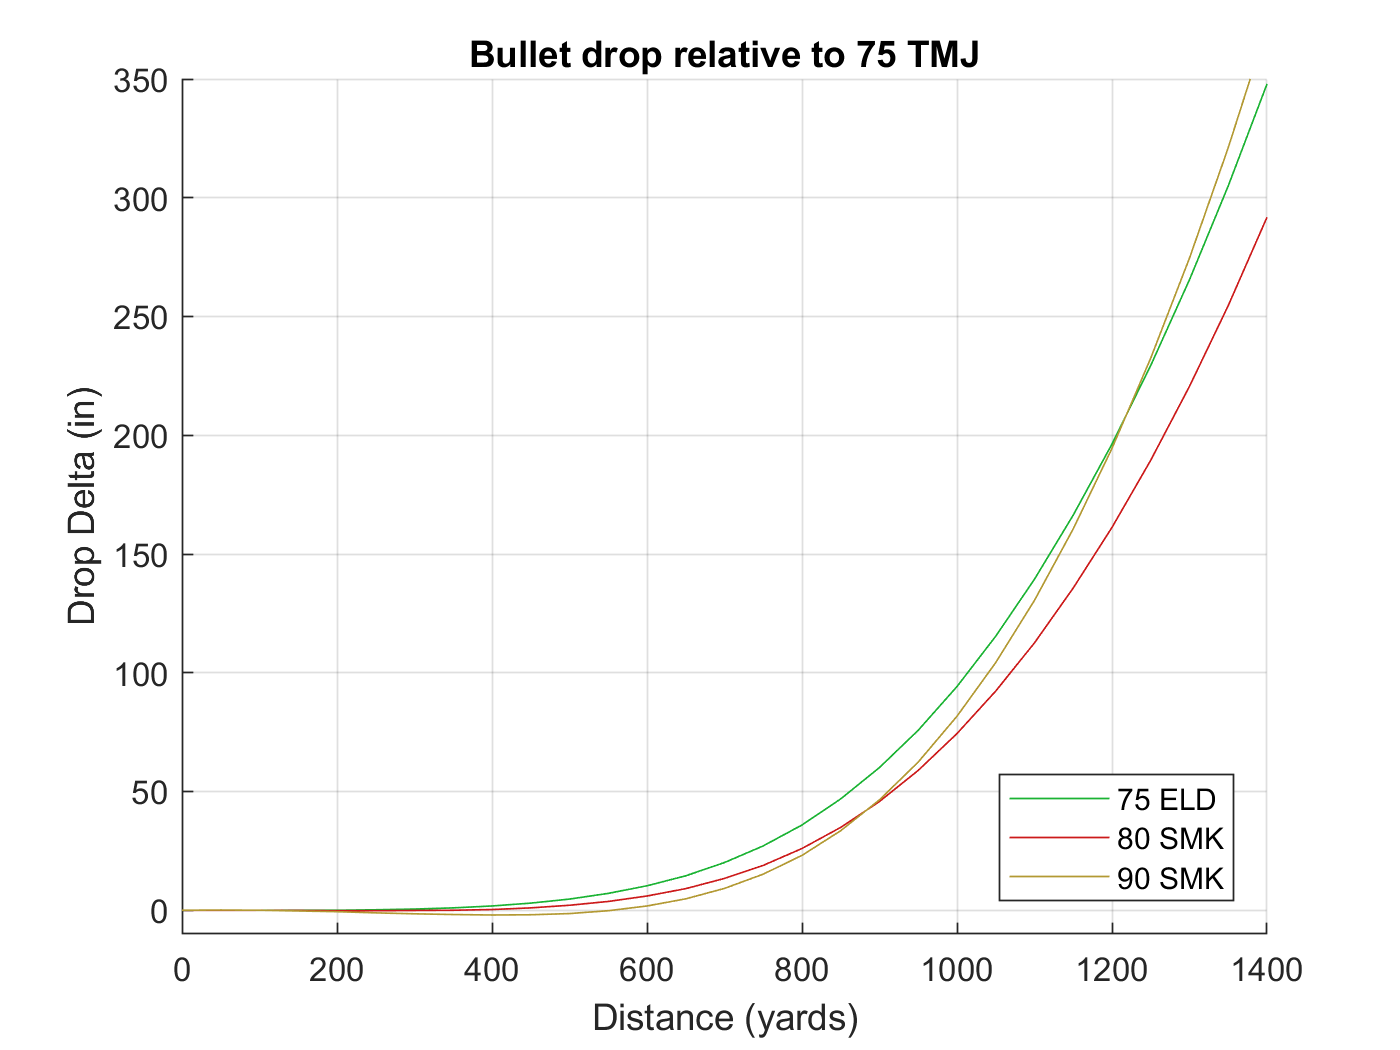
The above numbers give the following ballistics (drop, velocity, energy) for the 4 rounds:
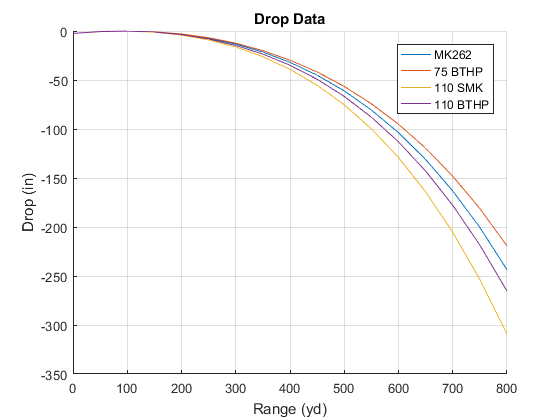
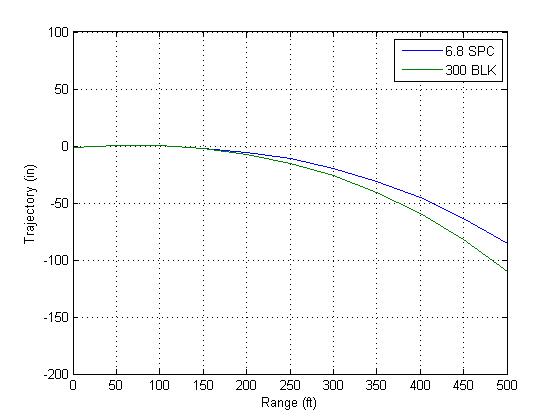
Drop data indicates the Hornady 75 grain BTHP loaded to the same energy as the MK262 is the best load considered. As range increases past 600 yards the 75 BTHP is dominant. The Sierra 115 grain MatchKing is a complete slouch and highly suboptimal. While an accurate bullet for shooting the 6.8 SPC out to 300 yards, it doesn’t have much purpose beyond this use. The 110 grain Hornady BTHP is vastly superior to the 115 SMK beyond 300 yards.
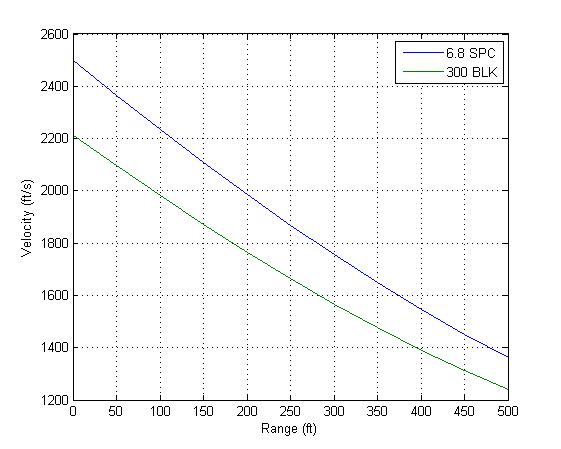
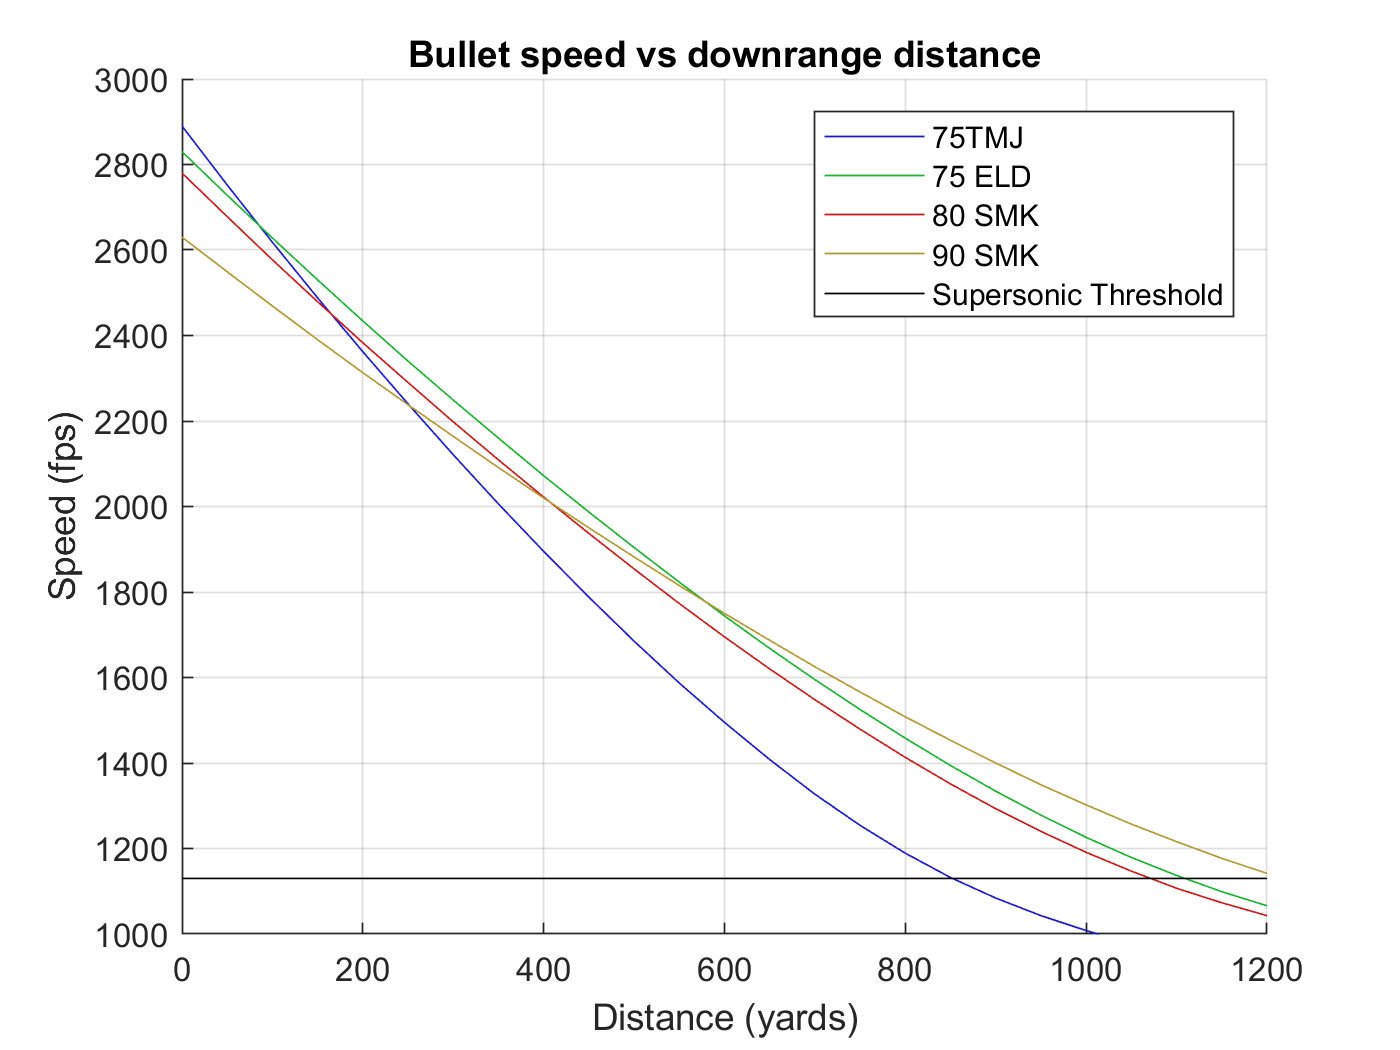
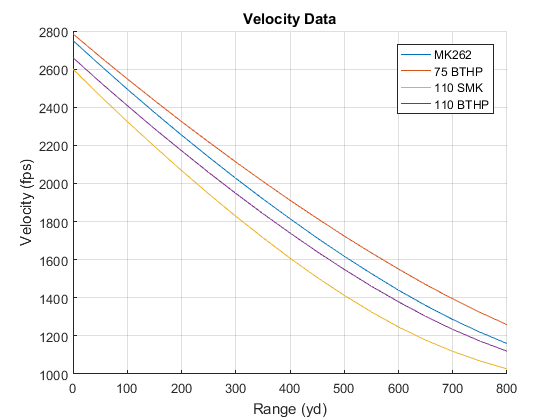 Velocity data is even more stark than the drop data. The disparities at the muzzle carry to all ranges, with the 75 BTHP blowing all challengers away. The 110 BTHP catches up to the MK262 with the 77 grain SMK. In this case the 110 BTHP stays above what NFA calls the transonic limit of 1300 fps past 750 yards while the MK262 achieves only about 680 yards with this distinction.
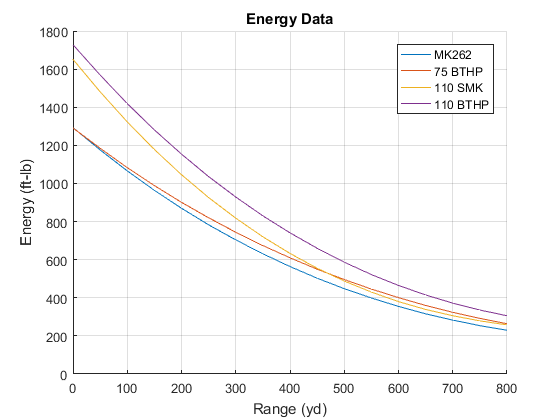
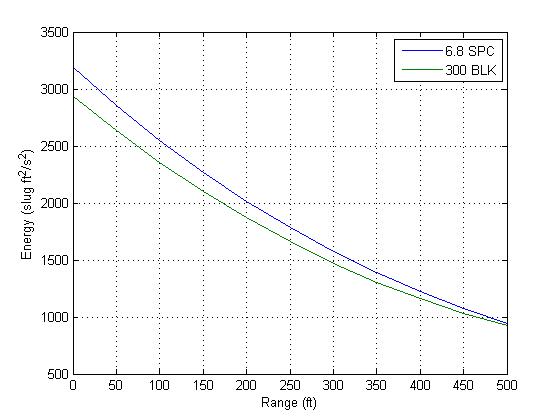
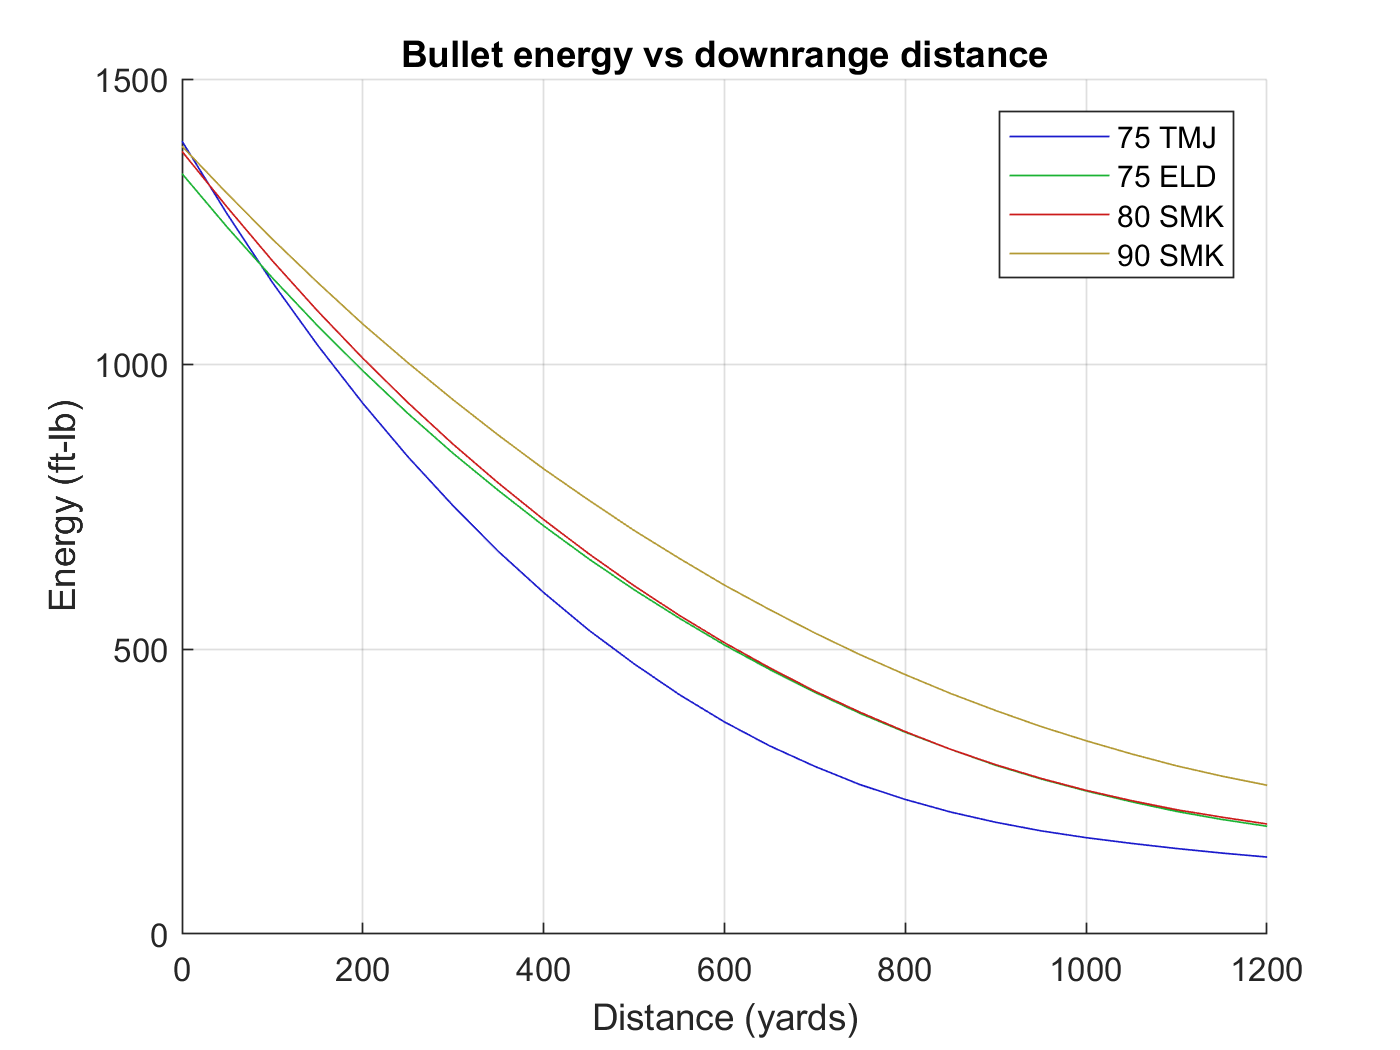
The energy plots show the clear advantage of the 6.8 SPC at close range, and to some degree shore up NFA regarding retained energy at range. However, when we adjust the ballistic coefficient of the 110 BTHP, it is clearly superior at range to all the other offerings. The 115 SMK is again demonstrated to be an inferior projectile, dumping most of its energy advantage by 400 yards. But still, with the adjusted BC for the projectile I find that it still carries more energy to 600 yards than the MK262. After 600 yards the 115 SMK likely loses velocity more quickly as it enters the transonic velocity range and its ballistic coefficient will decrease, which is not accounted for in these plots, which assume BC doesn’t change.
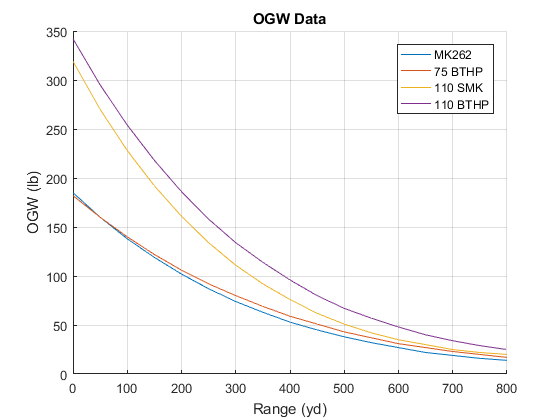
OGW is a commonly used metric, and one must be careful to use it to compare ballistics between similarly powered cartridges, similar caliber projectiles, and bullet construction and purpose. All of the above rounds listed in the above chart are spritzer boat tail jacketed projectiles and so are reasonably comparable for performance against similar targets. In this case the OGW is a useful metric and like energy shows the clear superiority of the 6.8 SPC over the two .223 caliber cartridges against which it is compared. By 500 yards the 115 SMK has given up all advantage but the 110 BTHP continues to be the superior cartridge at least to 650 to 700 yards, the point where the round reaches the transonic region of flight where the ballistic coefficient will decrease.
Returning to NFA claim that the 6.8 SPC is limited to form factors of 1.15, we consider the 110 AB and 120 SST, and add them to the comparison above. I recently measured the muzzle velocity of MK262, Hornady 120 SST, and Nosler 110 Accubond ammunition, all from 18″ Bison Armory barrels. The following data adds the performance of the new rounds for comparison. The 120 SST starts out the heaviest and slowest of the bunch at 2540fps but with an i7 form factor of 1.077. The 110 Accubond was able to push 2600fps and has the best i7 form factor of the 6.8mm projectiles at 1.073.
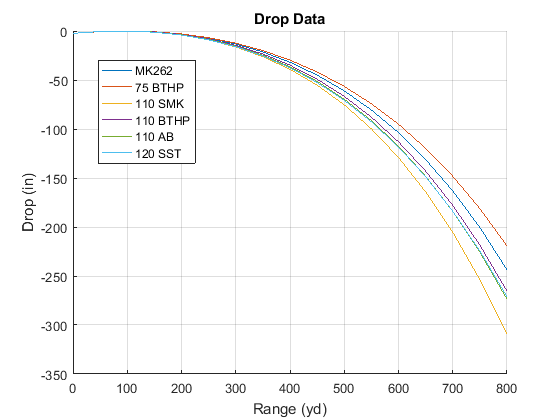
In terms of drop, the .224 caliber projectiles cannot be matched, and the 110 BTHP is still the best contender in the 6.8mm group, though the 120 SST and 110 Accubond keep up nicely. The 115 SMK drops like a rock.
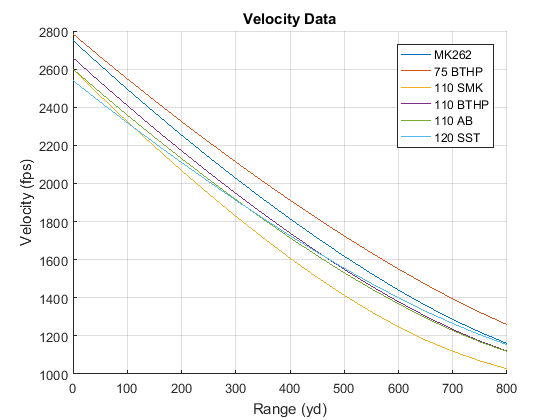
Velocity shows another story. Though the 75 BTHP is an outstanding projectile, the 120 SST nearly catches up to the MK262 and its 77 grain SMK by the beginning of the transonic region at 700 yards. The 110 Accubond starts out slower but effectively equals the 110 BTHP by 400 yards thanks to its low i7 form factor. The 115 SMK is left in the dust and again we see it is only suited for short range plinking and target use under 600 yards.

At short range, the energy of the 6.8mm SPC is in a different league than the 5.56 NATO offerings even with their modern relatively high power loadings. The 115 SMK really is a lousy bullet. The 120 SST is the superior cartridge/bullet combination, and if loaded as hot as the MK262 would outclass all comers by additional margin. The 110 Accubond and 110 BTHP could also be loaded in this way. We know from above that bolt thrust will increase, yet we have already mocked that concern and do not need to beat a dead horse. 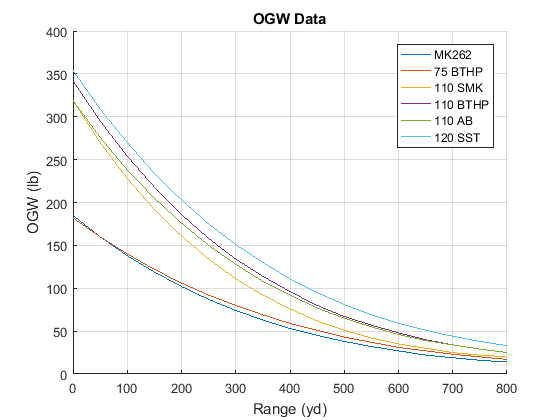
Considering OGW is effective again because the 110 Accubond and 120 SST are designed for hunting and as such the comparison above is conservative and shows the 110 Accubond equaling the 110 BTHP, while the 120 SST outmatches all comers. Considering bullet design in the mix puts the 110 Accubond above the 110 BTHP.
My treatment is terse, and for non-writers it is challenging to produce a quality article for anyone interested to read. I’m guessing Nathaniel F thought the same thing and so we can forgive the shortcomings of his interesting article that provides many good points for discussion. I think I have demonstrated that the 6.8 SPC has some distinct advantages compared with the 5.56 NATO when loaded to modern specifications, much the way the 5.56 NATO improves with modern propellants and superior projectiles.

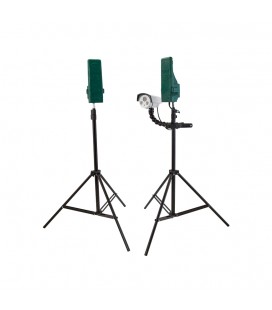 I have no Android or iOS devices So I had to improvise. You can log into the camera through a website. The IP address of the camera is marked on the side, which in my case is 192.168.0.3, and then provide the username admin with the password 12345 and you get to a menu written in Chinese. Selecting the second item in the menu gets you to the live feed from the camera.

![\[ J = F (t_2 - t_1), \]](https://www.bisonops.com/wp-content/ql-cache/quicklatex.com-d81232612cd6d8bcd60bb35c6c6e0c60_l3.png "Rendered by QuickLaTeX.com")
 , applied over a timespan starting at
  and ending at
  . An impulse is a change in momentum so we can also compute the impulse
  as
as![\[ J = mv_2 - mv_1 \]](https://www.bisonops.com/wp-content/ql-cache/quicklatex.com-6330aa944a335a05d92df305aad5a610_l3.png "Rendered by QuickLaTeX.com")
 is the starting velocity and
  is the end velocity, and m is the mass that we assume does not change for this analysis. From the previous two equations we can make the following equation:
![\[ mv_2 - mv_1 = F (t_2 - t_1) \]](https://www.bisonops.com/wp-content/ql-cache/quicklatex.com-5dcf73fa8335b1563046fdb88f629806_l3.png "Rendered by QuickLaTeX.com")
![\[ F = m (v_2 - v_1) / (t_2 - t_1) \]](https://www.bisonops.com/wp-content/ql-cache/quicklatex.com-a61e90ac1bdb273dcbabcc6b12de496a_l3.png "Rendered by QuickLaTeX.com")
 and
and  , and letting
  , the total time from ignition to uncorking, simplifies to
![\[ F = m v_2 / t \]](https://www.bisonops.com/wp-content/ql-cache/quicklatex.com-cfd6493530b10d88975c2e06a6764160_l3.png "Rendered by QuickLaTeX.com")
 which is regarded as the smallest sound pressure change the human ear can detect):
![\[ dB = 20log_{10}(P_{exit}/P_{ref}) \]](https://www.bisonops.com/wp-content/ql-cache/quicklatex.com-4c33a49fa69e18f0b632e4d2e1f4f003_l3.png "Rendered by QuickLaTeX.com")
![\[ dB_{1m} = dB_{muzzle} + 20log_{10}(r_{muzzle}/r_{shooter}) \]](https://www.bisonops.com/wp-content/ql-cache/quicklatex.com-a06d0663b46f1772ac5e80dc973c3263_l3.png "Rendered by QuickLaTeX.com")
 as the distance at the muzzle and 1m at the shooter to avoid taking the log of zero to get numbers that are typical of rifle report measurements.